Page 1 of 1
Cash Flow chart
Posted: Wed Jan 06, 2016 2:31 pm
by DavidB
I use probabilistic cash flow chart. Is it possible to view statistical distribution of cost for each time interval?
Re: Cash Flow chart
Posted: Wed Jan 06, 2016 2:43 pm
by Intaver Support
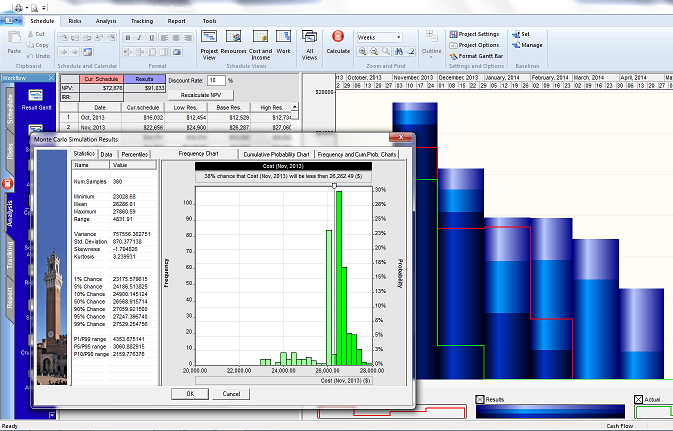
As part of risk analysis RiskyProject can calculate cost and income for each period of time. The results of analysis can be presented on probabilistic cash flow chart (Cash Flow view under Analysis). Periodicity is defined using a drop down list located at the bottom portion of the right pane. The chart can be shown weekly, monthly, yearly, etc.
Each bar of the chart is associated with statistical distribution. We can calculate low, base, and high estimate of cost and income. Each estimate can be associated with particular percentile of statistical distribution. For example, low can be P10 and high will be P90. Actual percentile can be defined in Schedule->Project Options->Calculation.
When you double click on each bar you can view a statistical distribution of cost or income associated with particular time period. As any other statistical distributions in RiskyProject this one can be presented as frequency, cumulative probability plots or their combination. You can copy this chart to clipboard and paste it to your presentation. You can also view statistics, percentiles and raw cost data associated with this time interval.