Page 1 of 1
Joint Confidence for Activities
Posted: Wed Oct 26, 2016 5:16 pm
by Torelli
Is there anyway to calculate the chance that a milestone will meet both cost and schedule goals?
Re: Joint Confidence for Activities
Posted: Wed Oct 26, 2016 5:22 pm
by Intaver Support
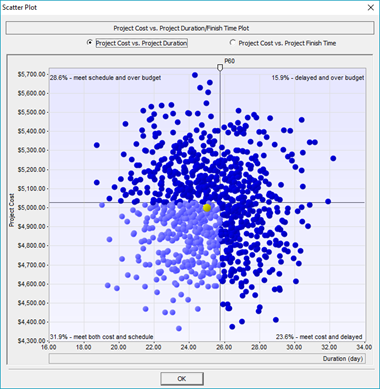
The probability that you will meet both cost and schedule objectives is often referred to as the Joint Confidence Level (JCL). RiskyProject calculates and visualizes the results on the Cost vs. Duration Scatter Plot that can be viewed from the Project Summary view. To view the JCL plot, click the Cost vs. Duration Scatter Plot button.
Joint Confidence is the product of the chance of meeting cost and duration values and can be expressed as JCL= ChanceDuration * ChanceCost where chance is expressed as a coefficient i.e. 0.5. With this in mind, it is possible to manually calculate the chance that you will meet both cost and schedule objectives for any activity in the schedule. Once you have run the simulation, open the Result Gantt. Select the milestone or activity that you want to calculate the joint confidence.
Click the Probability Plot button to open the simulation results. Double click on the Cost chart to bring up the details view. Using the Statistics view, check the Deterministic value. This should be your objective. Then compare this to the values in the Percentiles tab. The Percentiles listed are equal to the chance that you will meet that cost or be lower. Record the percentile that represent the deterministic value.
Repeat this for the Finish Time (or Duration) chart. You should end up with 2 values, for example Cost P35 and Finish Time is P55.
JCL = Cost (.35) * FinishTime (.55)
JCL= 19.25%
In layman’s terms this would mean you have a less than 1 in 5 chance of meeting both cost and schedule.