Project Control in RiskyProject
Moderator: Intaver Support
Project Control in RiskyProject
We usually update information about project performance by different teams or users in Microsoft Project as part of our project control procedure. Is it possible to use this information to recalculate the chance that project will be completed on time and on budget in RiskyProject?
Ken the PM
-
Intaver Support
- Posts: 995
- Joined: Wed Nov 09, 2005 9:55 am
Re: Project Control in RiskyProject
In RiskyProject you can perform project risk analysis on any phase of the project based on information from project control. Here is the process:
1. In Microsoft Project, Oracle Primavera or any other software where you maintain the original project schedule, you can enter information about % percent done for any task.
2. This information can be imported to RiskyProject. It is possible to enter % done (% completed) in RiskyProject using Tracking tab in Task Information dialog (double click on task ID).
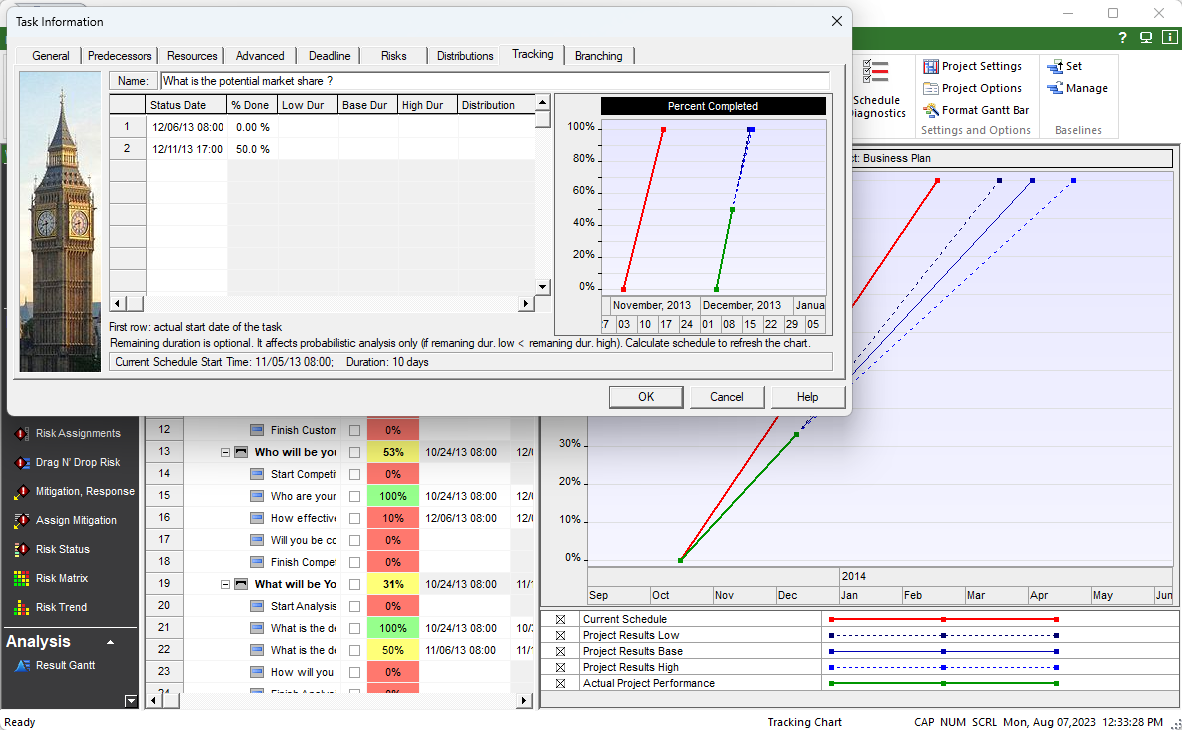
Note: RiskyProject does not support % work completed or % completed for individual user or item. Percent completed is only applied to the task
3. Percent completed is used yo calculate a remaining duration of the task and based on it a full duration of the tasks. It is done on each iteration of Monte Carlo simulation. Because remaining duration is uncertain, the result will statistical distribution of task duration with taking into an account percent completed.
4. Result will be presented as a "fork" for the while project or the project. It will show actual project performance (green line) and forecast (blue lines). They are associated with Low (e.g. P10), Mean, and high (e.g. P90) estimate of remaining project duration.
5. Such process can be repeated on each phase of the project.
1. In Microsoft Project, Oracle Primavera or any other software where you maintain the original project schedule, you can enter information about % percent done for any task.
2. This information can be imported to RiskyProject. It is possible to enter % done (% completed) in RiskyProject using Tracking tab in Task Information dialog (double click on task ID).
Note: RiskyProject does not support % work completed or % completed for individual user or item. Percent completed is only applied to the task
3. Percent completed is used yo calculate a remaining duration of the task and based on it a full duration of the tasks. It is done on each iteration of Monte Carlo simulation. Because remaining duration is uncertain, the result will statistical distribution of task duration with taking into an account percent completed.
4. Result will be presented as a "fork" for the while project or the project. It will show actual project performance (green line) and forecast (blue lines). They are associated with Low (e.g. P10), Mean, and high (e.g. P90) estimate of remaining project duration.
5. Such process can be repeated on each phase of the project.
Intaver Support Team
Intaver Institute Inc.
Home of Project Risk Management and Project Risk Analysis software RiskyProject
www.intaver.com
Intaver Institute Inc.
Home of Project Risk Management and Project Risk Analysis software RiskyProject
www.intaver.com