Page 1 of 1
Progress report
Posted: Tue Jun 23, 2020 3:10 pm
by KerryMiller
Can the RiskyProject Enterprise do a Progress report, indicating slippage, scope growth and progress to date. I see you do have progress dashboard and was wondering how this could be formatted (by myself) for reporting.
Re: Progress report
Posted: Tue Jun 23, 2020 3:13 pm
by Intaver Support
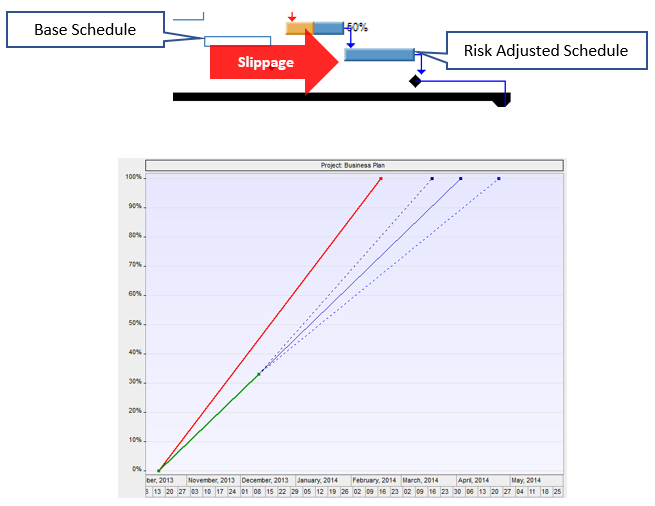
The focus of RiskyProject in terms of schedule analysis is on understanding potential impact of risks and uncertainties on future performance so its capabilities in this area is limited. The Tracking views present the project actuals along with forecasts based on progress. The Tracking Gantt presents project progress in a Gantt Chart view with % complete and status dates. Slippage is shown as the gap between the white bars (original schedule and the blue bars.
The Tracking Chart takes the same data and plots the original vs forecasted optimistic, mean, and pessimistic (set in Calculation Options).