Overview of Event Chain Methodology
RiskyProject software is implemented based on Event Chain Methodology. Event chain methodology is an uncertainty modeling and schedule network analysis technique that is focused on identifying and managing events and event chains that affect project schedules. Event chain methodology is the next advance beyond critical path method and critical chain project management.
Event Chain Methodology vs. Traditional Monte Carlo Method
The input information for Monte Carlo is uncertainties expressed statistical distributions of project activities’ duration and cost. In most cases, these are continuous statistical distributions defined by three point estimates, for example low, base, and high task duration. Appling Monte Carlo to project scheduling was a major step forward in project risk analysis. However ,this “traditional risk analysis” has a number of short comings:
- If you don`t have accurate historical data, it is hard elicit distribution parameters from subject matter experts. Let’s assume that we are trying to determine how long it would take a drive to a certain location. If you go to this location regularly, you may already know that it would be say from 30 to 40 minutes. But what if you have never travelled to it before. To make an accurate estimate you may need to sum up possible delays: it takes longer to leave your neighbourhood, there is an accident on the highway, you have trouble locating the correct address at the destination. With this process, you can generate an estimate for your arrival time that takes into account possible delays.
- Defining distributions is not a trivial process. Distributions are a very abstract concept that some project managers find difficult to work with. To define distributions accurately, project managers have to perform a few mental steps that can be easily overlooked especially with large project schedules. As a result they assign the same distribution for many tasks at the same time without carefully assessing actual uncertainties.
- Project managers perform certain recovery actions when a project slips. These actions in most cases are not taken into account by Monte Carlo. In this respect, Monte Carlo may generate overly pessimistic results.
The one of the solutions is to combine risk events in addition to statistical distributions.
Project risk analysis with events has been used since the early 2000s.. This approach is sometimes referred to as “Risk Drivers”. RiskyProject by Intaver Institute was one of the first software applications that performed project risk analysis with events. From the computational perspective, using statistical distributions and risk events are very similar. Risk events can be modeled using discrete or custom statistical distributions as part of “traditional” Monte Carlo process. The trick was how to make risk events a relatively simple process from the user perspective: it had to work in such a way that risks (with probabilities and impacts) from risk registers could be assigned to project activities and resources.
Project Risk Analysis with Events: A Psychological Perspective
One of the main problems with “traditional” Monte Carlo is that uncertainties defined in statistical distribution have on or more root causes; however , the root causes are an implicit rather than explicit property. For example, when we assign a statistical distributions of that is between 3 and 5 days., this uncertainty could be because of weather, performance of team members, problem with suppliers, etc. The issue is the probabilities and impacts of each risk event can be different and it is difficult to tell how these risks would contribute to statistical distributions of task duration without quantitative analysis.
Another issue related to ‘traditional’ Monte Carlo is confirmation bias. According to confirmation bias, people actively seek out and assign more weight to evidence that confirms their hypothesis, and to ignore or underweight evidence that could discount their hypothesis. As a result. people often try to find an evidence that supports their hypothesis and ignores evidence that contradicts their hypothesis. Using ‘traditional’ Monte Carlo with statistical distribution, project estimates (including low and high values) can be intentionally or unintentionally defined to satisfy a preconceived project finish time and cost. But risk events are usually identified separately (separate time, separate meeting, different experts, different planning department) from the schedule model and then are assign to the schedule. This allows project teams to separate the base project estimates from the impacts of risk. In other words, the task duration, start and finish time, cost, and other project input parameters are influenced by motivational factors to a much greater extent than risk event and this helps to reduce the impact of confirmation bias.
‘Traditional’ Monte Carlo also suffers from the anchoring heuristic. According to anchoring heuristic people rely on a single piece of information when making decisions. A more specific case of anchoring is called insufficient adjustment: people “anchor” on a current value and make insufficient adjustments for future effects. How does this work out in a project? Imagine at a planning meeting, the project manager asks the team how long it will take to complete a particular task. One of the senior team members quickly offers an estimate. Because it is the first value available all subsequent discussion about the tasks duration becomes anchored around the original estimate, even if it is completely wrong. So if the first estimate is 20 days, one of the other team members originally was going to provide an estimate of 30 days, but because of anchoring, he changes his estimate to 25 days. At which point, further investigation of the true most likely duration is unlikely. Then once the base estimate is set (e.g 22 days), the team will tend to be anchored to this value and when coming up with low and high estimates will unintentionally stick close to that anchor. They may multiply the duration on 0.9 and 1.1 to come up with low and high estimates. So they end up with an estimate been biased by anchoring and a probability distribution that is too narrow. Because risk events allow people to more accurately estimate what would happen if a risk occurs, analysis using risk events are less affect by anchoring and insufficient adjustment.
The probability of events can be easily calculated based on historical data, which can mitigate the effect of the availability heuristic. According to availability heuristic people make judgments about the probability of the occurrence of events by how easily these events are brought to mind. Low and base estimates in ‘traditional’ Monte Carlo suffer from the availability heuristic to a significantly greater extent than risk events. For example, a scheduler may recall primarily instances of the particular task that was completed early. The team may have had a small celebration or his manager came by and congratulated him on a job well done. This will make them more easy to remember and more likely to impact the scheduler’s and the estimate will be too optimistic. Compound events can be easyily broken into smaller events. The probability of events can be calculated using the relative frequency approach where probability equals the number of times an event occurred during a similar task or project divided by the total number projects in which it was listed. In ‘traditional’ Monte Carlo simulations, the statistical distribution of input parameters can also be obtained from the historical data; however, the procedure is more complicated and often not practical.
Another psychological effect is called optimism bias or planning fallacy. It is a cognitive bias that causes a person to believe that they are less likely to experience a negative event than others. Because of this fallacy, project managers tend to create overly optimistic estimates despite their best efforts. Optimism affects our estimates of the probability of risk events occurring and their impacts and the distribution used in ‘traditional’ Monte Carlo simulations. In first case, it leads a reduction in probabilities and impacts of risks. In the second case, it contributes to overly optimistic low and high estimates. However, the problem with overly optimistic low and high estimates may have significantly greater impact on accuracy of project schedules than overly optimistic probabilities and impacts estimate for individual risk. The reason is that when tasks are affected by multiple event, the cumulative impact of these events tends to provide a more accurate analysis that a standard 3 point estimate.
There are number of other psychological effects such as overconfidence that affect risk analysis in both ‘traditional’ and risk-based Monte Carlo. While using risk events, instead of or in addition to 3 point estimates, will not completely eliminate the impact of our psychological biases, it will help mitigate their negative impact.
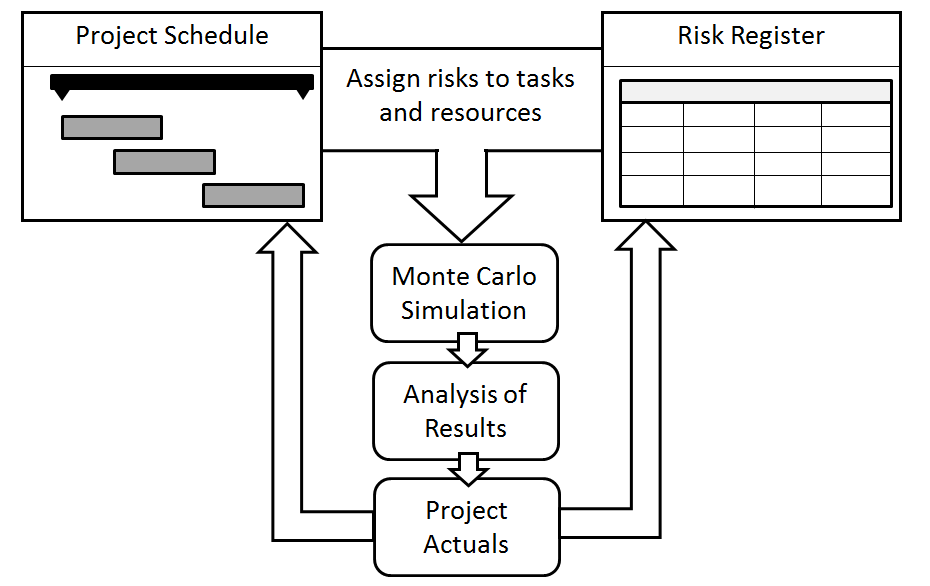
Basic Steps of Project Risk Analysis with Events
- Create a project schedule model using best-case scenario estimates of duration, cost, and other parameters. In other words, project managers should use estimates that they are comfortable with, which in many cases will be optimistic.
- Define a list of events and event chains with their probabilities and impacts on activities, resources, lags, and calendars. This list of events can be represented in the form of a risk register. Events from risk register should be assigned to tasks and resources.
- Perform Monte Carlo simulations. The results of Monte Carlo analysis are statistical distributions of the main project parameters (cost, duration, and finish time), as well as similar parameters associated with particular activities. Based on these results, you can determine not only the chance the project or activity will be completed on a certain date and cost.
- Analyze of results. The results of Monte Carlo analysis can be expressed on a project schedule as percentiles of start and finish times for activities it will be risk adjusted project plan You can also specific percentiles to set “risk adjusted’ schedule margin and management reserves Sensitivity analysis helps identify the crucial activities and critical events and event chains. Crucial activities and critical events and event chains have the most effect on the main project parameters. Reality checks may be used to validate whether the probability of the events are defined properly.
- Repeat the analysis on a regular basis during the course of a project based on actual project data and include any changes to the probability or impact of your risks. The probability and impact of risks can be reassessed based on actual project performance measurement. It helps to provide up to date forecasts of project duration, cost, or other parameters.
Click here to learn about basic principles of Event Chain Methodology.


