Edit or modify the Risk Dashboard
Moderator: Intaver Support
Edit or modify the Risk Dashboard
Just started reviewing the new dashboards. I would create a dashboard from scratch based on a template that we using in our organization. What is the best way to start?
Jason
-
Intaver Support
- Posts: 1015
- Joined: Wed Nov 09, 2005 9:55 am
Re: Edit or modify the Risk Dashboard
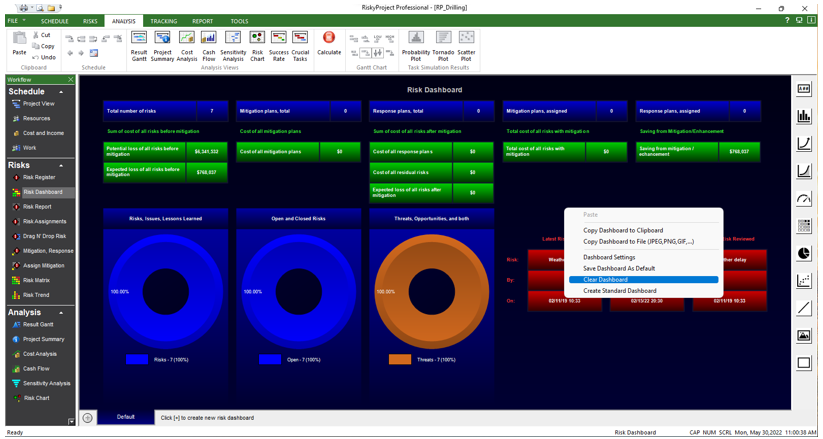
To start with an empty dashboard, right click on the dashboard and click Clear Dashboard.
However, it can be useful to reuse some of the existing elements. In this case, you may want do a comparison between the current dashboard and your template. For example, you can reuse existing text boxes or KPIs and reformat text or modify the select KPIs.
To do this. Select and then right click on a dashboard element to open the menu that allows you to modify the selection.
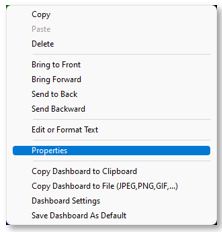
Selecting Edit or Format Text opens a dialog box that allows you to modify the font type, color, size and alignment. If it is a text box, this will also include a text field.
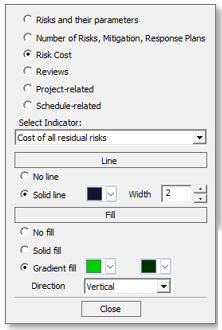
Selecting Properties will open a dialog box specific to the type of element. For KPIS you will be presented with a dialog that allow you to select a KPI and edit the text box.
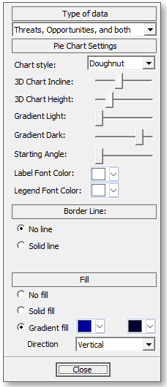
If you select a chart, the properties dialog box will include the available formatting options for the specific chart type. The example below is for Pie Charts. Each chart type (Pie, Bar, Line, Area, Scatter, Matrix, and Meters) has a menu with specific controls.
For additional information, see our dashboard tutorials https://youtu.be/psfj-remV3k
However, it can be useful to reuse some of the existing elements. In this case, you may want do a comparison between the current dashboard and your template. For example, you can reuse existing text boxes or KPIs and reformat text or modify the select KPIs.
To do this. Select and then right click on a dashboard element to open the menu that allows you to modify the selection.
Selecting Edit or Format Text opens a dialog box that allows you to modify the font type, color, size and alignment. If it is a text box, this will also include a text field.
Selecting Properties will open a dialog box specific to the type of element. For KPIS you will be presented with a dialog that allow you to select a KPI and edit the text box.
If you select a chart, the properties dialog box will include the available formatting options for the specific chart type. The example below is for Pie Charts. Each chart type (Pie, Bar, Line, Area, Scatter, Matrix, and Meters) has a menu with specific controls.
For additional information, see our dashboard tutorials https://youtu.be/psfj-remV3k
Intaver Support Team
Intaver Institute Inc.
Home of Project Risk Management and Project Risk Analysis software RiskyProject
www.intaver.com
Intaver Institute Inc.
Home of Project Risk Management and Project Risk Analysis software RiskyProject
www.intaver.com