Scenario Analysis
Moderator: Intaver Support
Scenario Analysis
Is there any way to analyze various scenario in one schedule and overlay the output charts to visualize the difference?
-
Intaver Support
- Posts: 1047
- Joined: Wed Nov 09, 2005 9:55 am
Re: Scenario Analysis
To analyze multiple scenarios, you must create multiple baselines (scenarios) and save them with their results. Cumulative probability for multiple baselines can be plotted on the same chart. First you need to create at least 2 baselines and save the results with the baseline: for example, pre and post-mitigated.
To create a baseline with results of the analysis. Once you have run a simulation on your project, you can save the results as a baseline.
1. Run the simulation.
2. Click the Schedule tab. In the Baselines group, click Set.
3. Enter a name for the baseline
4. Select Current Schedule and Results of Analysis to save as the baseline.

5. Click OK.
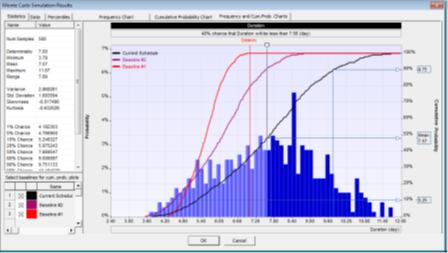
You have now added a single baseline. Now you can create a post-mitigated baseline. This is the schedule that has the risk mitigation modifications to the schedule which can include both modifications to the risks, but also the schedule or costs. Once you have made the changes, run a simulation and create the post-mitigated baseline by repeating the steps above Once you have at least two baselines, the baselines will appear as multiple cumulative probability plots any of the simulation charts with Cumulative Probability enabled. The example below has 3 different cumulative probabilities plotted. You can create and plot up to 10 baselines in any one project.

To create a baseline with results of the analysis. Once you have run a simulation on your project, you can save the results as a baseline.
1. Run the simulation.
2. Click the Schedule tab. In the Baselines group, click Set.
3. Enter a name for the baseline
4. Select Current Schedule and Results of Analysis to save as the baseline.

5. Click OK.
You have now added a single baseline. Now you can create a post-mitigated baseline. This is the schedule that has the risk mitigation modifications to the schedule which can include both modifications to the risks, but also the schedule or costs. Once you have made the changes, run a simulation and create the post-mitigated baseline by repeating the steps above Once you have at least two baselines, the baselines will appear as multiple cumulative probability plots any of the simulation charts with Cumulative Probability enabled. The example below has 3 different cumulative probabilities plotted. You can create and plot up to 10 baselines in any one project.

Intaver Support Team
Intaver Institute Inc.
Home of Project Risk Management and Project Risk Analysis software RiskyProject
www.intaver.com
Intaver Institute Inc.
Home of Project Risk Management and Project Risk Analysis software RiskyProject
www.intaver.com