Does the test version allow you see to results (s-curves and other charts)?
I am testing it right now, and when I click on the "results Gantt" on an activity bar, I don't get the s-curves and other results.
Viewing results in the test version
Moderator: Intaver Support
Viewing results in the test version
Ken the PM
-
Intaver Support
- Posts: 1050
- Joined: Wed Nov 09, 2005 9:55 am
Re: Viewing results in the test version
hank you for your interest in RiskyProject.
The "test" or trial version is fully functional with no differences from the commercial version.
On the Result Gantt
1. Select an activity for which you want to view the results.
2. On the ribbon, click the Analysis tab.
3. In the Task Simulation Results, click Probability Plot.
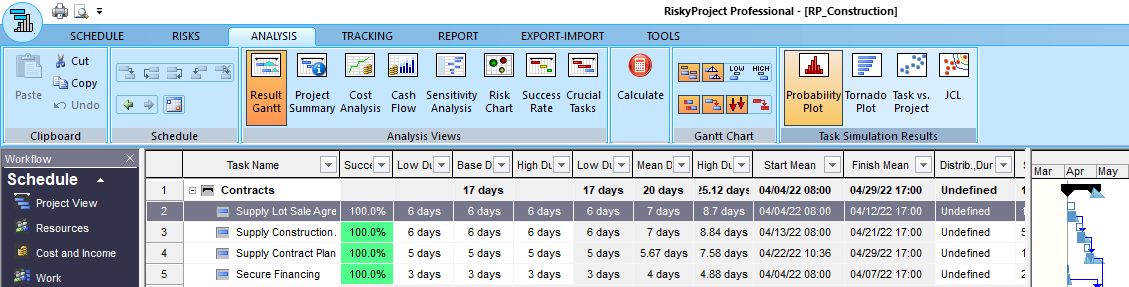
The Simulation Results window opens.
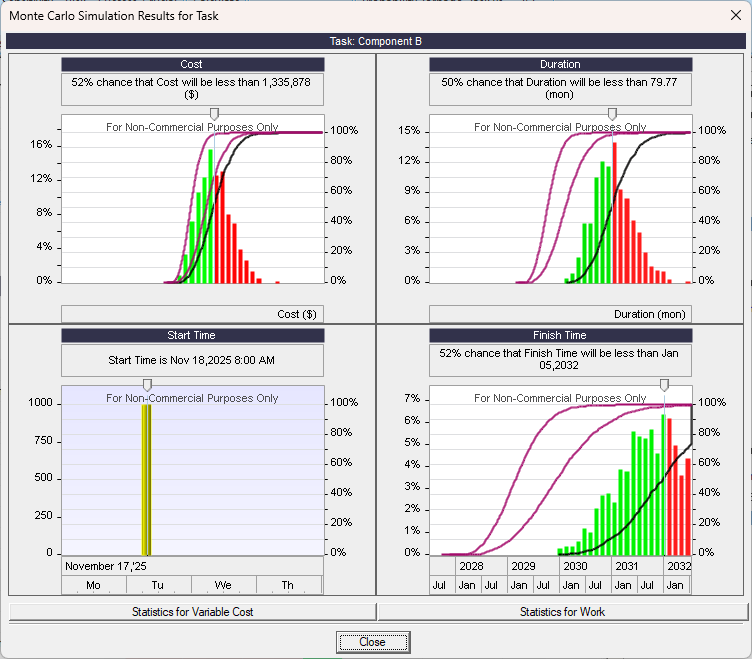
4. Double-click on a chart to view a detailed graph.
Hope that helps
The "test" or trial version is fully functional with no differences from the commercial version.
On the Result Gantt
1. Select an activity for which you want to view the results.
2. On the ribbon, click the Analysis tab.
3. In the Task Simulation Results, click Probability Plot.
The Simulation Results window opens.
4. Double-click on a chart to view a detailed graph.
Hope that helps
Intaver Support Team
Intaver Institute Inc.
Home of Project Risk Management and Project Risk Analysis software RiskyProject
www.intaver.com
Intaver Institute Inc.
Home of Project Risk Management and Project Risk Analysis software RiskyProject
www.intaver.com