Customizing anlaysis charts
Posted: Fri Jan 09, 2026 5:37 pm
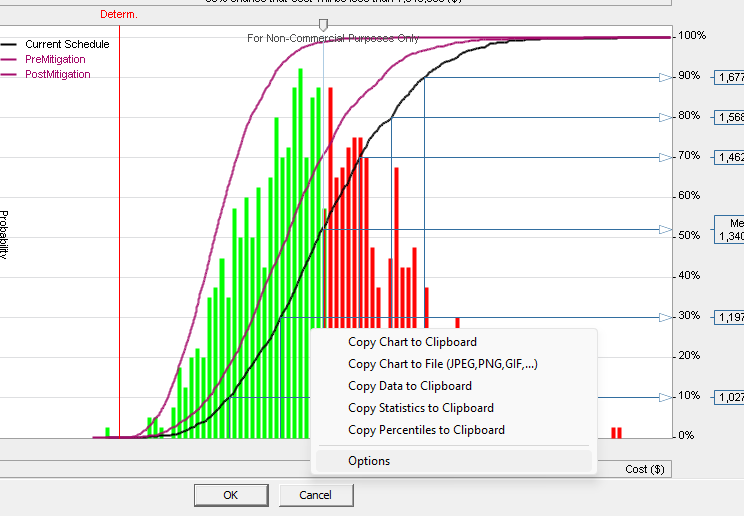
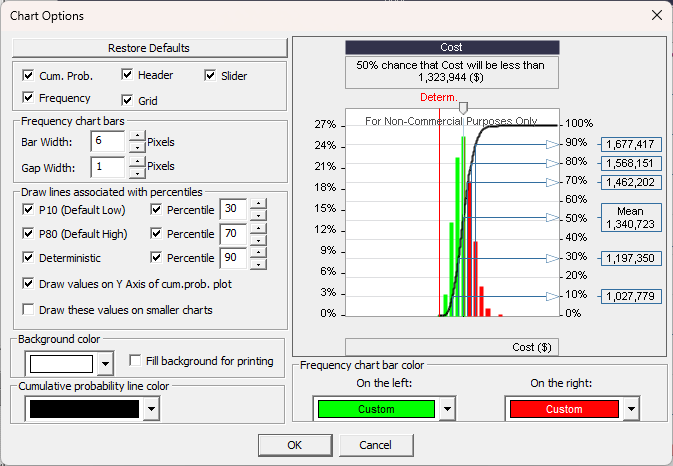
Is it possible to customize the charts that are shown in the Project Summary.
This forum includes discussions about project risk analysis software and project risk management software RiskyProject: theory, software features, best practices, possible problems, and user experience.
https://intaver.com/IntaverFrm/