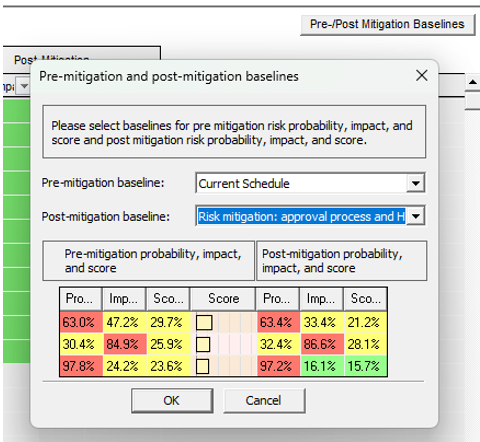
I ran Monte Carlo analysis with pre-mitigation probability and impact, and I received the results.
I can see that without mitigation the project Mechanical completion is due at a date with high probability. I also recorded the mitigation actions which reduced the probability and in some cases the impact as well. I also assigned the mitigation actions to the relevant tasks and ran again the Monte Carlo simulation but received totally the same result as I got previously.
My question that how can I see the difference between values in Finish High column? I tried to save more Baselines, but I can not make the program run the simulation with the post-mitigation probability and impact.
Pre and Post-Mitigation Simulation Results
Moderator: Intaver Support
-
Intaver Support
- Posts: 1037
- Joined: Wed Nov 09, 2005 9:55 am
Re: Pre and Post-Mitigation Simulation Results
The problem appears to be that you have not created a post mitigated baseline with reduced probabilities etc due to the mitigation activities. Assigning mitigation activities in the waterfall chart are only a forecast but do not impact the simulation results. To create a post mitigated baseline, you need to create a new baseline, that have the post-mitigated probabilities and impacts as well as include the risk mitigation activities as tasks in the schedule. The procedure can be found here: http://www.intaver.com/Help4/RP_Help.ph ... ePlan.html.
Once you have created the post-mitigated baseline, select the post mitigate baseline from the Pre and Post Mitigation Baselines dialog box.

Once you have created the post-mitigated baseline, select the post mitigate baseline from the Pre and Post Mitigation Baselines dialog box.

Intaver Support Team
Intaver Institute Inc.
Home of Project Risk Management and Project Risk Analysis software RiskyProject
www.intaver.com
Intaver Institute Inc.
Home of Project Risk Management and Project Risk Analysis software RiskyProject
www.intaver.com