Page 1 of 1

Viewing results in the test version

Posted: Fri Jan 09, 2026 4:44 pm
by Ken
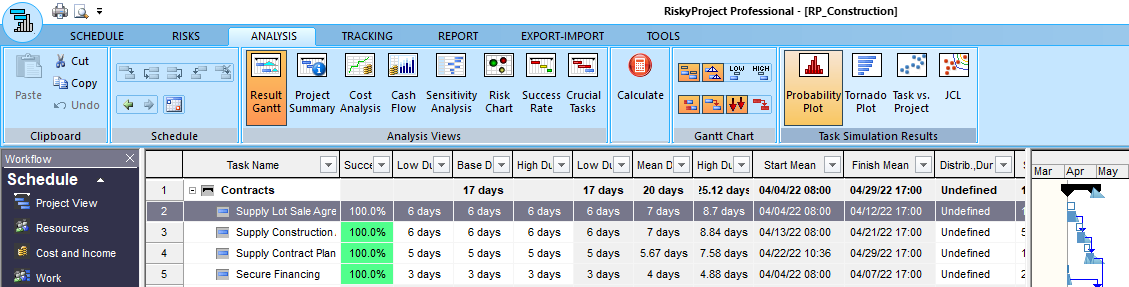
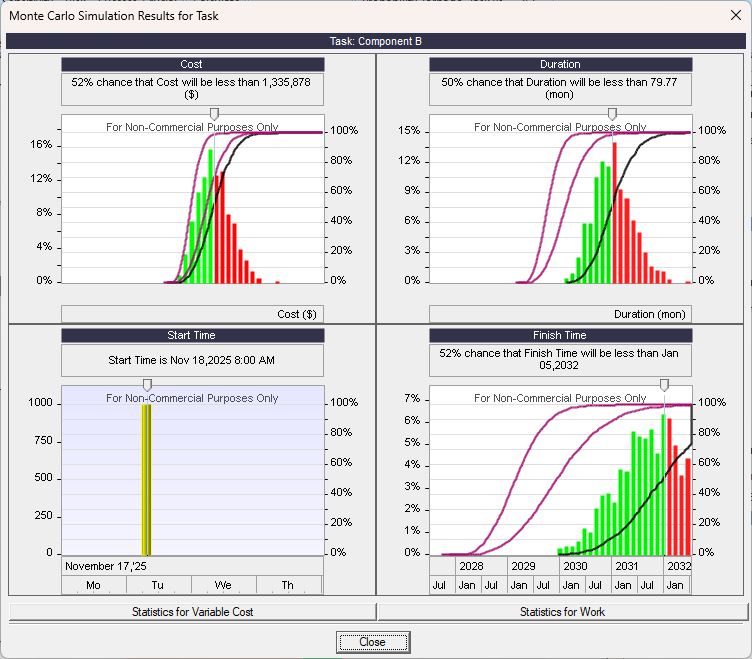
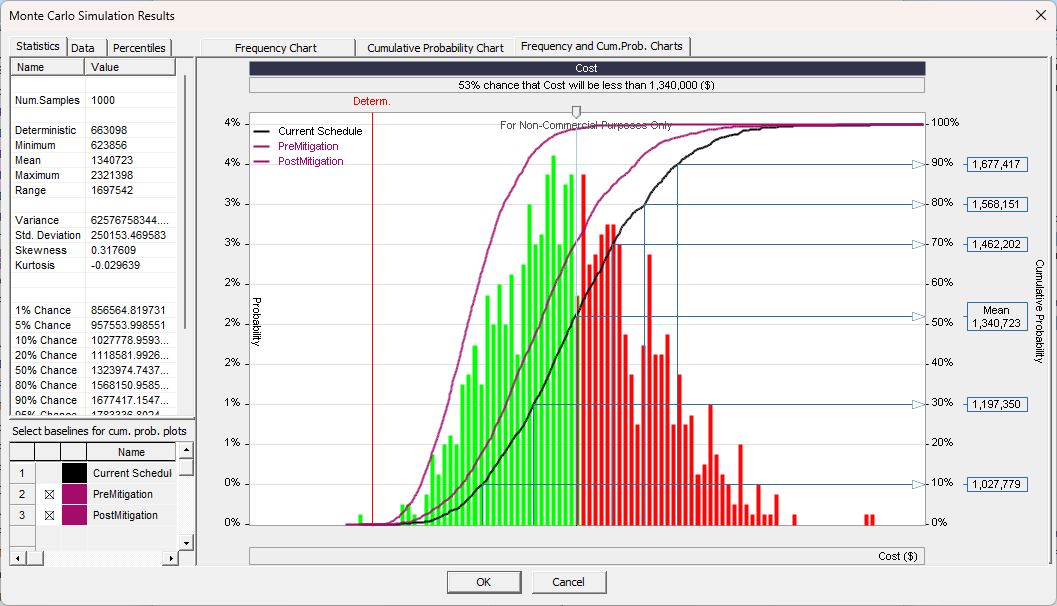
Does the test version allow you see to results (s-curves and other charts)?
I am testing it right now, and when I click on the "results Gantt" on an activity bar, I don't get the s-curves and other results.

Re: Viewing results in the test version

Posted: Fri Jan 09, 2026 4:57 pm
by Intaver Support
hank you for your interest in RiskyProject.
The "test" or trial version is fully functional with no differences from the commercial version.

On the Result Gantt

1. Select an activity for which you want to view the results.

2. On the ribbon, click the Analysis tab.

3. In the Task Simulation Results, click Probability Plot.

Image

The Simulation Results window opens.

Image

4. Double-click on a chart to view a detailed graph.

Image

Hope that helps