|
Quantitative Risk Analysis with Microsoft Project
Monte Carlo Simulation with
Microsoft Project
To overcome the challenges, associated with the PERT method, Monte Carlo simulations can be used as an alternative. Monte Carlo is a mathematical method used on risk analysis in many areas and is used to approximate the distribution of potential results based on probabilistic inputs. Each simulation is generated by randomly pulling a sample value for each input variable from its defined probability distribution, e.g. uniform, normal, lognormal, triangular, beta, etc. These input sample values are then used to calculate the results, i.e. total project duration, total project cost, project finish time. The inputs can be task duration, cost, start and finish time, etc. This procedure is then repeated until the probability distributions are sufficiently well represented to achieve the desired level of accuracy. They are used to calculate the critical path, slack values, etc. Monte Carlo simulations have been proven an effective methodology for the analysis of project schedule with uncertainties.
To use Monte Carlo simulations with Microsoft Project you need to have add-on tool. There are a number of such tools available on market. These software tools will help you find answer on the questions such as:
- What is the chance of your project being completed on schedule and within budget?
- What is the chance that the particular task will be on the critical path?
- What tasks affect the project duration at most?
- What is the project success rate?
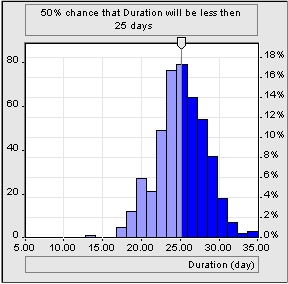
Each Monte Simulation tool has its own specific functionalities; however, some features are common for all of them. First, all of these software allow the user to: assign different statistical distributions including custom distributions to project inputs (task duration, cost, etc.), perform Monte Carlo simulation, and output results in different formats. For example, you can use a frequency or cumulative probability charts or histograms to see the chance that the project will be completed within a given period of time. You can calculate the criticality index or probability that a task lies on the critical tasks.
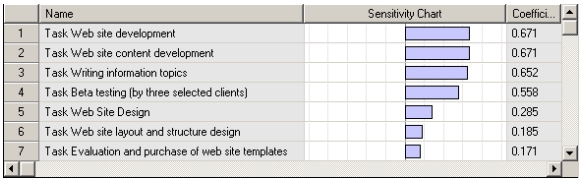
You can perform a sensitivity analysis or calculate how sensitive the project outputs (project duration, cost, risks, finish times, etc.) are to the uncertainties of the project inputs (task duration, finish time, etc.). Results of sensitivity analysis can be shown on a the
chart. The tasks which are listed highest on the chart have the potential to affect project duration the most.
Monte Carlo simulation tools may offer features such as probabilistic or conditional branching. An example of probabilistic branching is when the user defines that there is 40% chance that task A will be successor of task B and 60% chance that task C will be successor of task B. An example of conditional branching is when the user defines that task A task will be followed by task B if task A duration is greater or less then a certain value.
The classic Monte Carlo simulation method has a number of limitations. Statistical distributions of project inputs such as task durations should be obtained based on reliable historical data and in many cases this data is available. For example, a project manager usually knows that particular construction job will task between 1 and 3 days and can be defined by normal distribution. However, in some cases, especially for research and development projects, this information is not available and using Monte Carlo simulation may not improve your estimations. It is also very important to constantly track your project performance and update input data and associated distributions using performance measurement data. Another problem associated with Monte Carlo simulations is that, if a project slips, project managers usually perform certain actions. It is difficult to define and forecast the management response within a Monte Carlo simulation method.
To overcome these and other challenges Event Chain Methodology has been developed as an extension of the classic Monte Carlo simulation method. Project uncertainties can be defined as a set of risks or probabilistic events (risk lists), which can be assigned to tasks, resources, or project schedule. Such events can occur at the middle of the task and can lead to task delay, restart, cancellation, etc. Events can cause other events and generate event chains. Project managers cam monitor these events, determine the critical risks - which affect project schedules the most - and mitigate them. Event Chain Methodology allows you to perform Quantitative Risk Analysis by combining project schedule and risk lists.
You do not need to be a statistician to use Monte Carlo simulation tools with Microsoft Project. They are designed for project managers who want to bring the power of Quantitative Risk Analysis to the project. Project managers are successfully using such tools in different industries for years.
|
