 |
|
|
Analyzing Cost and Revenue
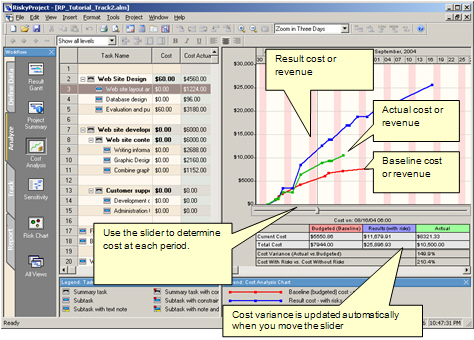
Use the Cost Analysis view to analyze cost and revenue on each stage
of the project. The Cost Analysis view has up to three cost
diagrams:

You may use the slider to determine:
• Cost Variance (actual vs. budgeted cost)
• Cost with Risks and uncertainties vs. Current schedule
(budgeted) cost.
• If income is defined for at least one task, the cost analysis
diagram will show the project revenue calculated based on the
formula: Revenue = Income – Cost.
• If Cost exceeds Income in any given period of time Revenue will be
negative.
• If income is not defined, Cost will be always positive.
• Use
the shortcut menu to manipulate with chart. In particular, instead
of presenting a line chart of current schedule, result, and actual
cost, you can present an area chart by choosing Fill Chart
from the shortcut menu.
|
See
also
Cost, Income, and Revenue Calculations in RiskyProject
Revenue Reports View
|
