Defining statistical distribution for risk outcomes
You can define risk outcome as a range defined by a statistical distribution.
For quantitative analysis (when you have a project schedule), you can define statistical distribution for
"Relative delay", "Fixed Delay", "Fixed Cost Increase":
You may enter LOW OUTCOME, OUTCOME, HIGH OUTCOME, and DISTRIBUTION for risk outcomes in the following dialogs and views:
- Risk tabs in Task Information Dialog (double click on Task ID)
- Risk tabs in Resource Information Dialog (double click on Resource ID)
- Gantt Chart (double click on risk arrow)
- Risk Drag'n'Drop view when you assign risk to tasks or resources
For qualitative analysis (when you have a project schedule), you may
enter LOW OUTCOME, OUTCOME, HIGH OUTCOME, and DISTRIBUTION for risk outcomes in Risk Register,
Risk Information Dialog box (double click on Risk ID).
Statistical distribution for risk outcomes are disabled by default. To enable probabilistic risk outcomes:
- Go to Options.
- Click the Risk tab.
- Select the Enable statistical distribution for risk outcome checkbox.
Once enabled, this setting is the default for all RiskyProject files on your computer.
-
Click the Risks tab. In the Risk Views
group, click Risk Register.
- Open the Risk Information dialog box.
-
Click the Probabilities and Outcomes tab for qualitative
risk analysis (if you don'tr have project schedule) or Assign to tasks or
resources for quantitative analysis
-
Right click on risk alternative ID and select Distribution of risk
outcomes
-
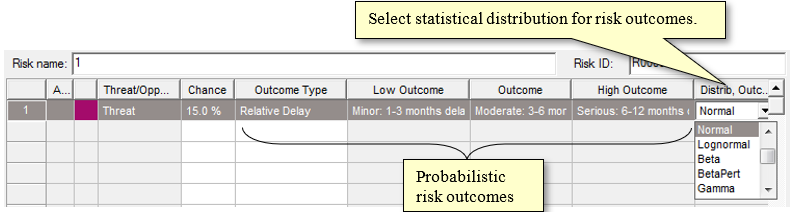
Select the distribution from the Distribution list. If you select Undefined, the
base value will be used for all iterations.
-
Define the distribution parameters. The Probability Density chart is
automatically updated. You can adjust distribution parameters using the sliders.
-
If you use a custom or discrete distribution, a grid opens. The grid will allow
you to define points (or intervals for discrete distributions) and associated
with each point (interval).
-
If you select Normal or Lognormal, you must select
the Low and High probability range (P1 and P99, P5 and P95 or P10 and P90).
These are "cut-off" parameters; meaning that duration, cost, or start time
cannot go beyond these values.
If you perform qualitative risk analysis in Risk Register you can view:
-
Impact (pre-mitigation or post-mitigation) for all categories: it is calculated as mean value of you have for
probabilistic risk outcome.
-
Impact for individual categories (e.g. Impact: Cost or Impact: Schedule): it is input base value of Outome
See also
About Risk Assignments
|