Search Help:
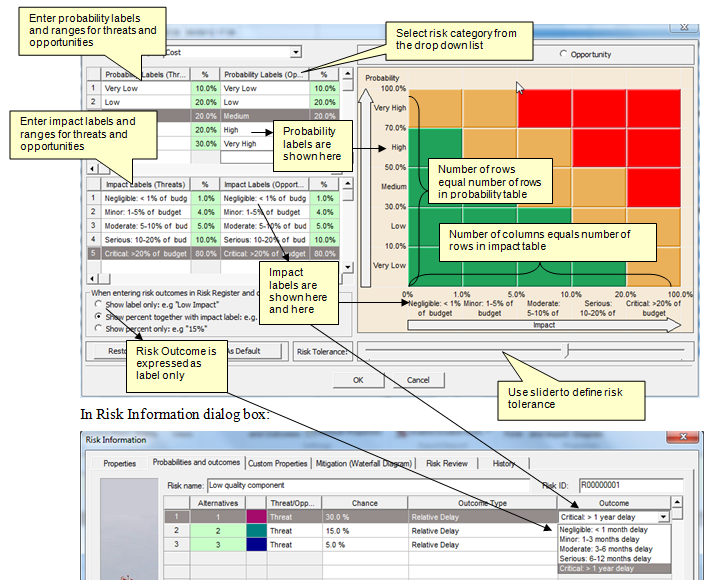
Formatting the Risk MatrixYou can modify the Risk Matrix to define the risk matrix's number of row and columns, define labels and the risk tolerance display. These settings will be used in Risk Matrix view. Risk ToleranceThe level of risk tolerance is shows using color-coding (for threats: green: low risk, yellow: medium risk, red: high risk). A high number of green cells on the chart indicates a high risk tolerance. A high number of red cells on the chart indicates a low risk tolerance. Color-coding for opportunities is the opposite. Number of Rows and Columns, Labels for Probabilities and ImpactsIn the Format Risk Matrix dialog box, the number of rows in the Probability table corresponds with number of rows of the risk matrix and number of rows in Impact table corresponds with number of columns of the risk matrix. Therefore, to add or remove row or column of the risk matrix, simply add or remove the label in the probability or impact table. You can define probability and impact for different labels for each risk category. In addition, you may define different labels for threats and opportunities. For example, if in the Duration category, the impact label for "Threats" is "Low: 1 month delay", the impact label for the opportunity in the same category is "Low: 1 month acceleration". If you do not define labels for a risk category, the default set of labels will be used. You may modify the default set of labels by selecting "Default" from drop down list and then editing as required. Probability labels are used only in the Risk Matrix; impact labels used appear in the Risk Matrix as well as to define outcomes of each risk in Probabilities and outcomes tab of Risk Information dialog box. For example, an impact label "Low: 1 month delay" will be shown on the horizontal axis of the Risk Matrix. In addition, when you define the impact of a risk, which has an outcome type "Relative delay", you will be able to select the outcome "Low: 1 month delay".
To format the Risk Matrix:
You can save your settings to the system registry for all new projects on your computer. To save these settings, click the Set as Default button. These new defaults will not affect any previous projects. You can also restore the pre-defined set of categories and outcome types by clicking on the Restore Defaults button. See also |