|
Results Gantt Chart
RiskyProject displays the start and finish ranges of each task in
the Result Gantt view. The calculated project and baseline schedules
are shown in the same Gantt chart. You can use the task bar for
deterministic current schedule to compare deterministic and
probabilistic schedules.
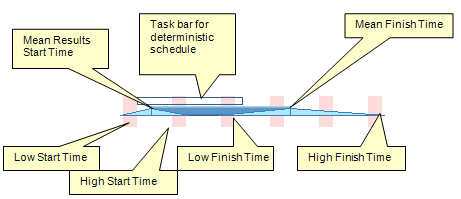
You can display Result Gantt associated only with low (optimistic)
and high (pessimistic) results.
Showing or Hiding Low/High Results
1. Right-click on the chart and a shortcut menu opens.
2. From the shortcut menu, choose one of the following viewing
options:
• Show Low/High Results
• Show Low Results
• Show High Results
• Show Current Schedule.
See also
Project Summary
The Project Dashboard 3x3
|
