|
Risk Assignments on the Gantt Chart
Risks and issues can be shown on the Gantt chart as arrows:
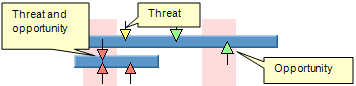
Colors represent the calculated the impact of the risk on all
project parameters combined. The size of the arrow represents
probability. You may click on each risk arrow within a Gantt chart
to be presented with information about risks:
• Only local risks are shown as arrows.
• You cannot add or remove mutually exclusive alternatives
using this dialog, but you can chance of occurrence, outcomes,
result, and moment of risk.
Showing or hiding risks on the Gantt chart
• Click the
 button with a standard toolbar to toggle the risk arrows on or off.
See also
Risks in RiskyProject
Assigning local and global risks
|
