|
Risk Matrix
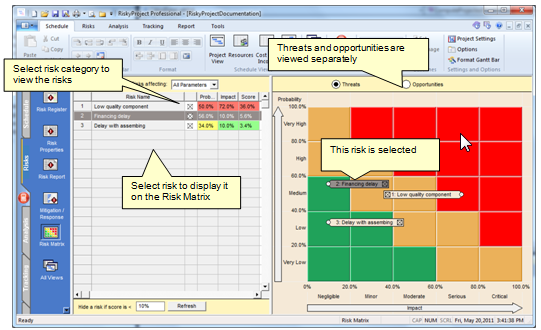
A Risk Matrix is a tool used in the Risk Assessment process that allows you to determine the severity of a risk occurring .The Risk Matrix view shows this using the risk probability (y-axis) vs. calculated risk impact (x-axis)of the project risks.
The Risk Matrix view is divided into two sections: a table with a list of risks with their actual calculated values for probability, impact, and score. When you select these risks, they are shown visually on a matrix, which provides a visual comparison of this data put as well as putting each risk into the context of your organization’s risk tolerance. Is the risk in the green, yellow, or red areas of the matrix?
Viewing the Risk Matrix
1. Select a risk category from the Risks affected drop-down list. Lists of all risks associated with the selected risk category are listed in the table. Select All Parameters to view all of the risks in all risk categories.
2. Select the Threats or Opportunities option at the top of the matrix. Threats and opportunities cannot be viewed at the same time.
3. Select the check boxes beside the risk names to view the risks on the Risk Matrix. To hide a risk, simply clear the check box. By default, risks with zero impact cannot be selected.
Copy the risk matrix to the clipboard or save as a JPEG file
1. Right click on the Risk Matrix.
2. Choose Copy to Clipboard as Metafile, Copy to Clipboard as Bitmap, or Copy Chart to JPEG file.
3. If you chose to create a JPEG file, you will be prompted to save it to a directory.
See also
Formatting Risk Matrix
|
