

RiskyProject Project Risk Management and Risk Analysis Software Suite
Contact Intaver Institute to learn more about this and other features of RiskyProject.
RiskyProject provides a unified, quantitative approach to modeling combined cost and schedule uncertainty.
The Value of Integrated Cost and Schedule Risk Analysis
-
-
- Risk-Adjusted Cost Contingency and Management Reserves: Cost and schedule contingencies are often established as simple percentages of the project budget or schedule without accounting for the project’s actual level of risk. By measuring how time-dependent costs affect the overall project budget, RiskyProject can help establish cost and schedule contingencies based on your organization’s specific risk appetite, such as P80 or P90 confidence levels. For example, RiskyProject can calculate that a project has an 80% probability of meeting its schedule target and an 85% probability of meeting its cost target.
- Capturing Time-Dependent Costs: Time-dependent expenses typically account for 40% to 70% of total project costs. Integrated analysis captures these variable costs as task durations increase or decrease because of schedule uncertainties or risk events that occur during simulations. For example, if a risk increases a task’s duration by 30% and resources with defined rates are assigned to that task, the task’s resource cost will also increase by approximately 30%.
-
- Improved Risk Prioritization: Risk events can affect both cost and schedule. RiskyProject calculates separate risk scores for cost and schedule, as well as a combined risk score. The combined risk score provides a more comprehensive representation of a risk’s overall impact and enables more accurate risk ranking and prioritization for risk response activities. For example, in RiskyProject, you can assign a weight of 0.6 to the schedule risk score and 0.4 to the cost risk score. If the schedule risk score is 0.3 and the cost risk score is 0.5, the overall risk score is: 0.3 × 0.6 + 0.5 × 0.4 = 0.38
-
How Integrated Cost and Schedule Modeling Works
RiskyProject calculates cost and schedule uncertainties during every iteration of a Monte Carlo simulation.
1. Create a High-Quality Schedule Network: Develop a logic-driven schedule with complete predecessor/successor relationships and without artificial constraints or padded buffers.
- Define Resource Allocations and Rates: Assign work and material resources with clearly defined rate structures to model time-dependent project costs.
- Add Fixed Cost Estimates: Enter base cost estimates for non-resource-related costs without embedding arbitrary contingency reserves.
-
2. Create a Structured Risk Register: Evaluate project risks by assigning probabilities and defining their potential cost and schedule impacts where appropriate. These risks can then be assigned to specific tasks. For example, a risk may increase a task’s duration by 20% and its fixed cost by 30%.
3. Define Uncertainties in Cost and Schedule
- Fixed Task Cost Uncertainties: Define three-point estimates using probability distributions such as Triangular, Beta, or Lognormal for non-resource fixed costs.
- Define Uncertainties in Work: When schedule risk events or duration uncertainties extend activity durations, resource work and associated costs can increase proportionately.
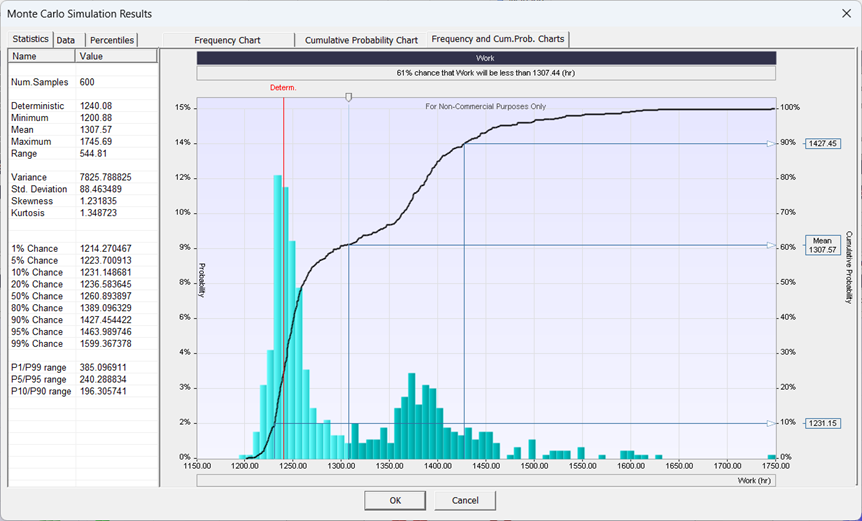
Statistical Distribution of Project Work
4. Perform Monte Carlo Simulations: RiskyProject performs Monte Carlo simulations to model the combined effects of cost uncertainty and schedule uncertainty.
5. Generate Analytics and Reports: RiskyProject converts complex simulation results into clear, actionable visual reports for project teams and executives, including:
- Histograms and Cumulative Probability Plots: Represent uncertainty in task or project duration, fixed and variable costs, start and finish times, and work.
- Joint Confidence Level Plots: Scatter plots that show the combined probability of meeting project cost and schedule targets simultaneously.
- Cumulative Cost and Cash Flow Plots: Show how project costs accumulate and change over time.
- Risk-Adjusted Project Schedule: Presents the project schedule while accounting for identified risks and uncertainties.
- Sensitivity Analysis Results: Tornado charts identify the activities and risks, that have the greatest influence on project outcomes.
- Risk Scoring and Severity Ranking: Help identify and prioritize the risks that have the greatest potential impact on project cost and schedule objectives.