


RiskyProject Lite – Affordable, Powerful Risk Analysis for Project Teams
RiskyProject Lite is a easy to use solution for schedule and cost risk analysis with Monte Carlo simulation, designed specifically for project managers who want to improve project predictability without the complexity or high price tag of advanced software. Integrating with your existing project management tools, such as Oracle Primavera P6 and Microsoft Project, RiskyProject Lite delivers essential risk management tools to help you make smarter decisions and deliver projects with greater confidence — all while staying within budget.
What You Can Do with RiskyProject Lite
 Analyze Cost and Schedule Risks with Monte Carlo Simulations
- Run Monte Carlo simulations using three-point estimates of duration and cost and risk events (risk drivers)
- Perform Monte Carlo analysis on project schedules of virtually any type or size—from small schedules to very large integrated programs containing tens of thousands of activities.
- Create realistic, risk-adjusted schedules
 Integrate Without Disruption
- Compatible with Microsoft Project, Oracle Primavera, Excel, and others
- Import your existing schedules with ease — no rework needed
🛠 Manage Risk from Every Angle
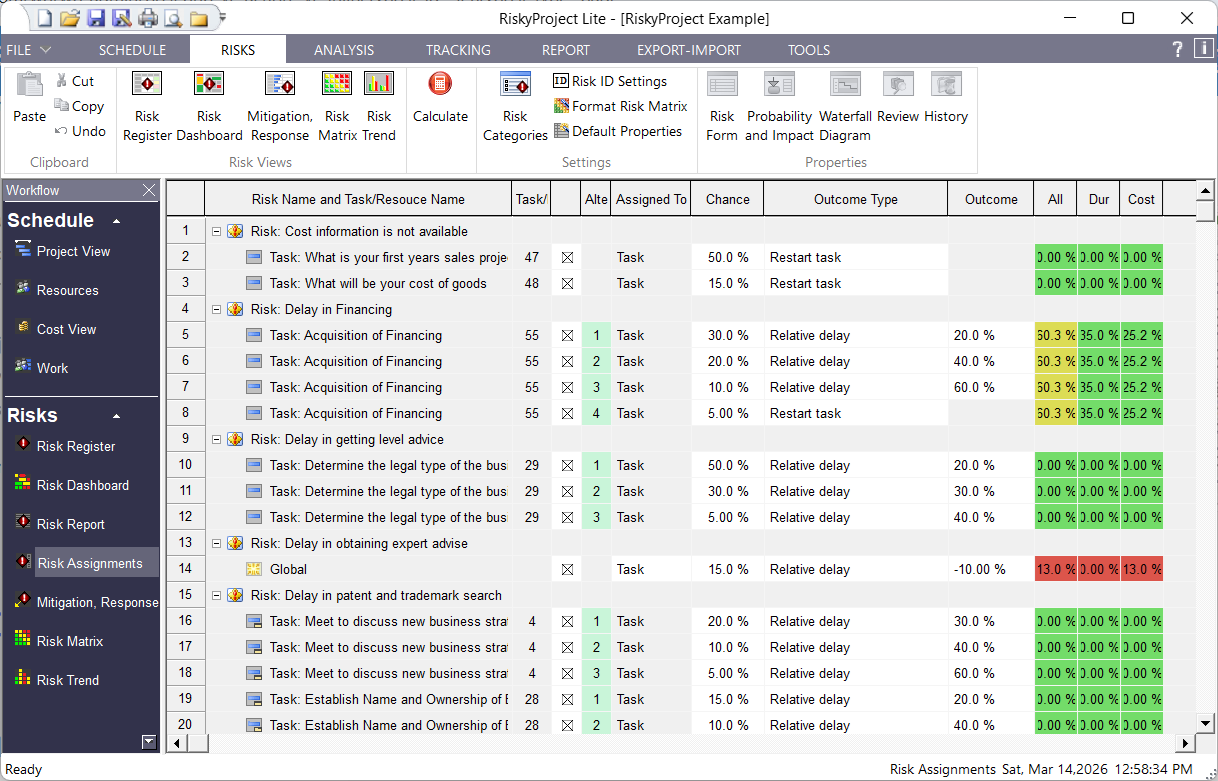
- Build or import risk registers with customizable categories and scoring
- Link risks directly to tasks to see true cost and schedule impacts
- Design mitigation and response plans and see their impact with the Mitigation Waterfall Diagram
 Generate Insightful, Custom Reports
- Create or customize project and risk dashboards
- View Risk Matrixes, Risk Trend Charts, and other customizable risk reports
- Create statistics reports, frequency histograms, cumulative probability chats, Tornado charts, scatter plots, cash flow projections, and other visuals
- Share data-driven insights with stakeholders and decision-makers
Monitor Project Performance in Real Time
- Perform project control with risks and uncertainties
- Update forecasts with actual progress data
Project Scheduling
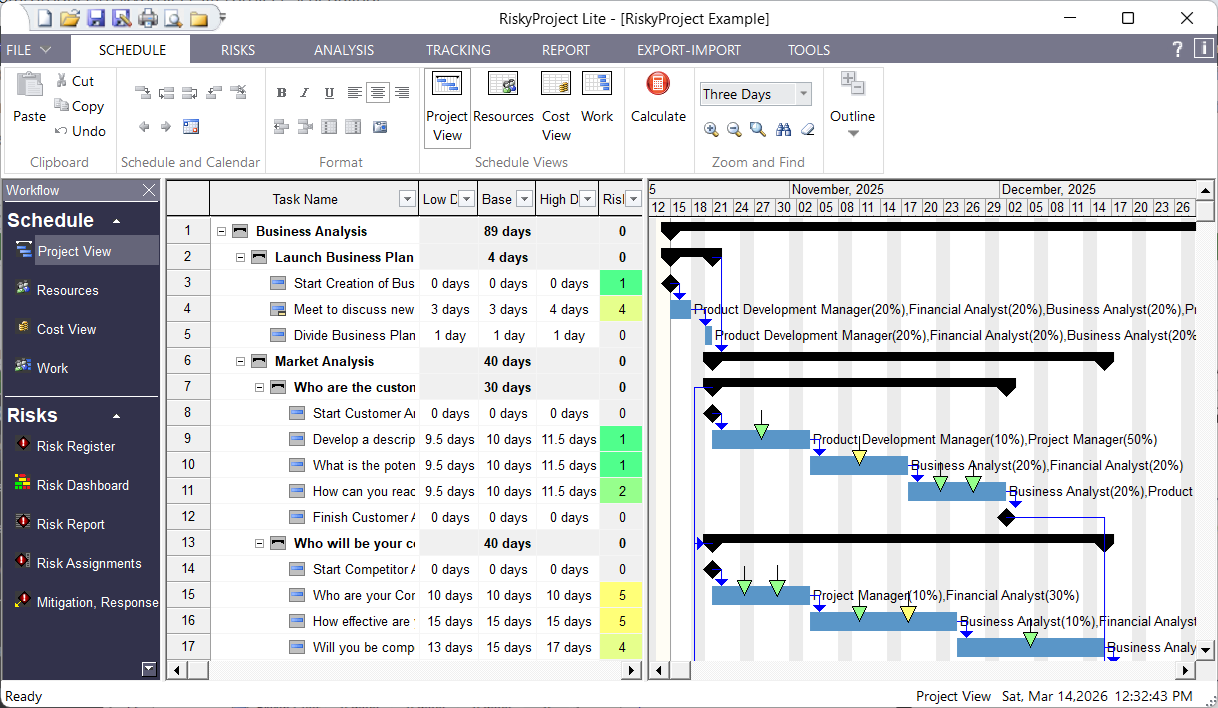
RiskyProject is built around its own scheduling system. You can define task parameters, relationships between them, constraints, resources, and cost without using Microsoft® Project, Oracle® Primavera, or any other scheduling software.
However, if you are already a user of Project, Oracle Primavera, or other project management software, you can seamlessly open project, created by these applications and augment existing data by assigning uncertainties to your tasks and projects.
Schedule Risk Analysis and Risk Management
Risk Register and Risk Form
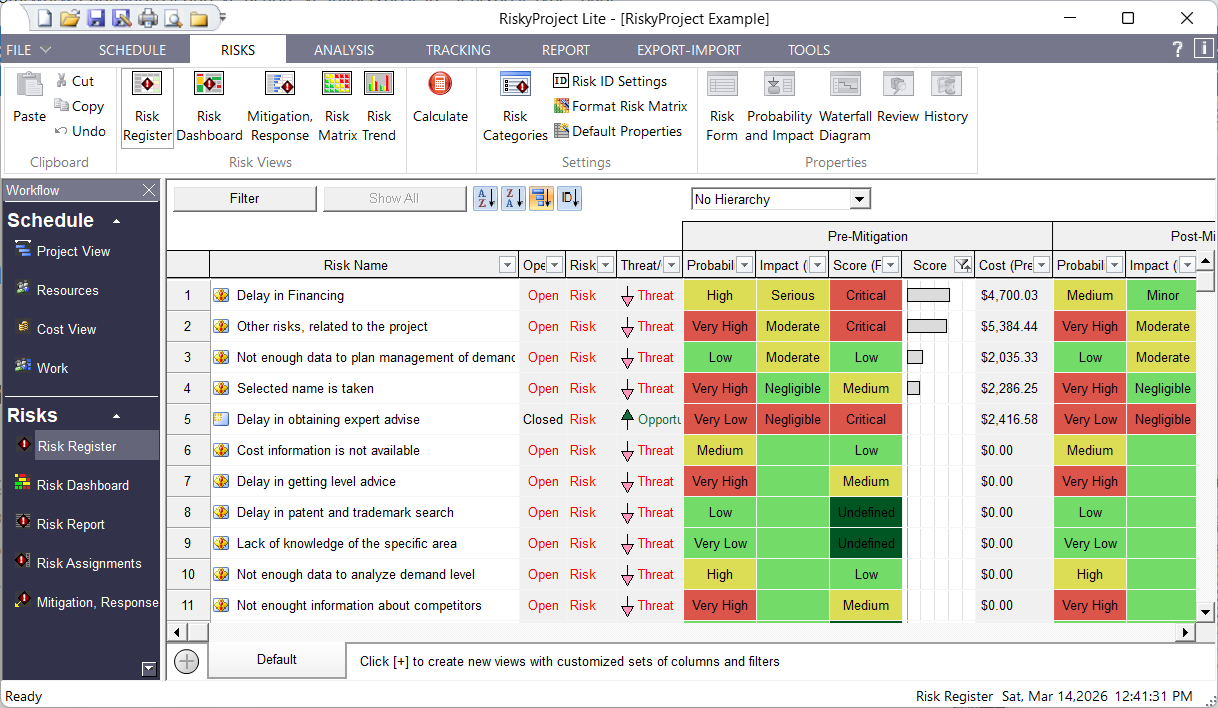
A risk register is a set of all risks and issues in the project. Issues are risks that have occurred and therefore are having an actual affect on your project. You can easily convert risks to issues. You can open and close risks. Risks in the risk register may have different properties (owner, recorder, contact, date recorded, date converted to issue, location, etc.). You may customize any properties for all projects.
Risk Form is a fully customizable form to enter risk properties, as well risk probabilities and impacts. You can create any risk properties or select them from the list of predefined properties. Then you can drop them on the form. The form can be annotated with lines and text. Once you design a form it can be used for all future projects.
Risk Matrix and Risk Trend
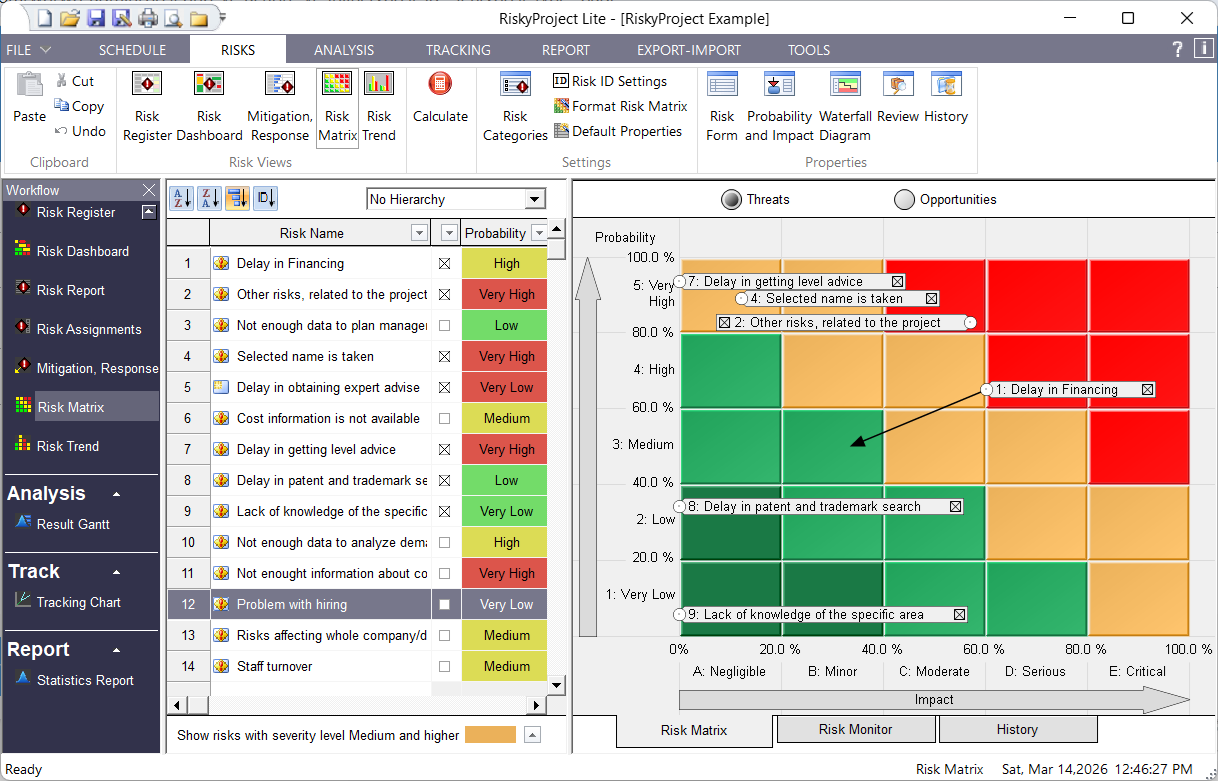
Risk Matrix and Risk Trend views allow you to determine the severity of a risk and analyze how risks are changing over time:
- The Risk Matrix is a tool that allows you to determine the severity of a risk. The Risk Matrix view shows this using the risk probability (y-axis) vs. calculated risk impact (x-axis) of the project risks. The Risk Matrix view is divided into two sections: a table with a list of risks with their actual calculated values for probability, impact, and score. When you select these risks, they are shown visually on a matrix, which provides a visual comparison of this data put as well as putting each risk into the context of your organization’s risk tolerance. Changes in probability and impact due to mitigation plans added to a risk’s mitigation waterfall chart will automatically be displayed in the Risk Matrix.
- The Risk History shows how the probability and impact of an individual risk has changed over time.
- The Risk Monitor shows the number of risks per cell in the risk matrix.
- The Risk Trend shows how project risk change over time. The Risk Trend can be presented as bar chart or in table format (Total Risks).
Managing Mitigation and Response Plans
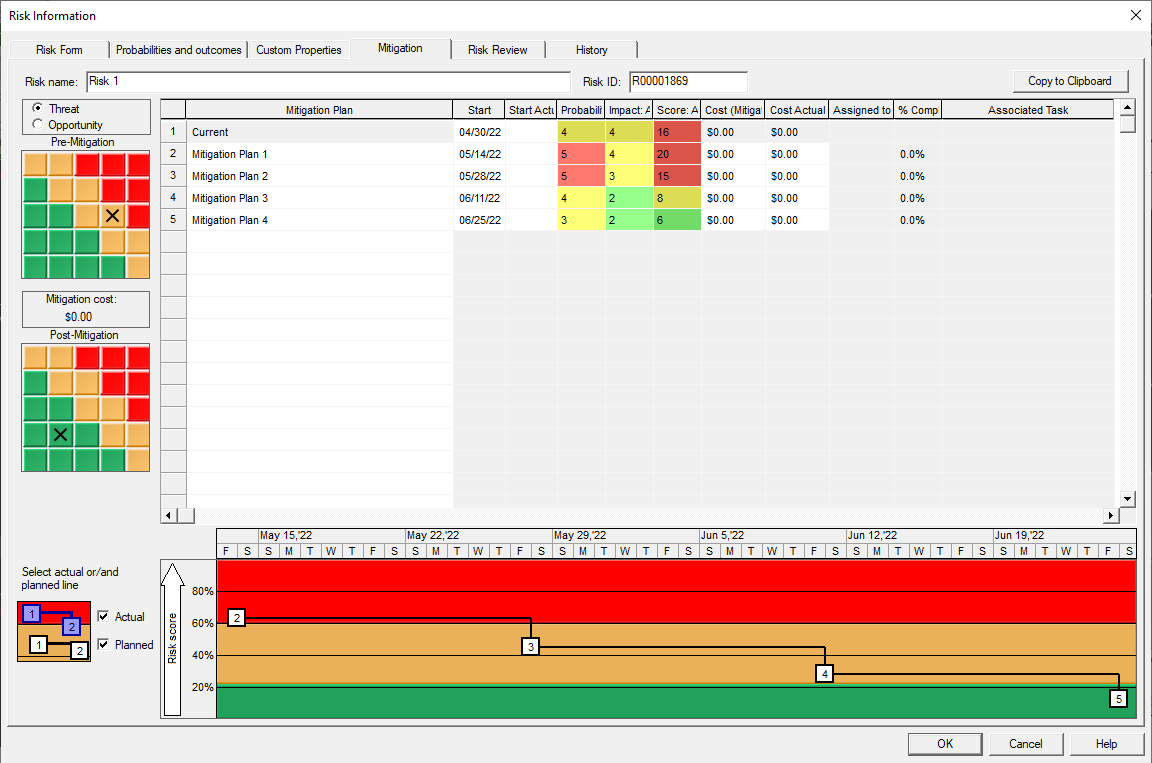
In RiskyProject you can model risk mitigation or response efforts. Response plans are activities that are executed when a risk occurs and are used for quantitative risk analysis. Mitigation plans are actions that are performed to minimize risk probability and/or impact and can be visualized using the Risk Mitigation Waterfall diagram.
All mitigation and response plans can be saved in a separate Mitigation and Response Plan Registry. The plans can now be linked to tasks or a group of tasks within a project schedule. This linking will read the schedule data into the mitigation plan to calculate costs and planned finish and actuals.
Assigning Risks to Tasks and Resources
Setting up your project for risk analysis has never been easier. RiskyProject’s interface is designed to allow you to quickly add and edit your project risks. To assign risk to tasks you may use risk register, global and local risk views, assign them separately for each task or resource.
RiskyProject allows you to define default settings for task, resource and risk parameters and when you need help an interactive system of legends and on-screen help messages will guide you though the process of modeling your project schedule.
Quantitative Risk Analysis and Project Control
Result Gantt Chart
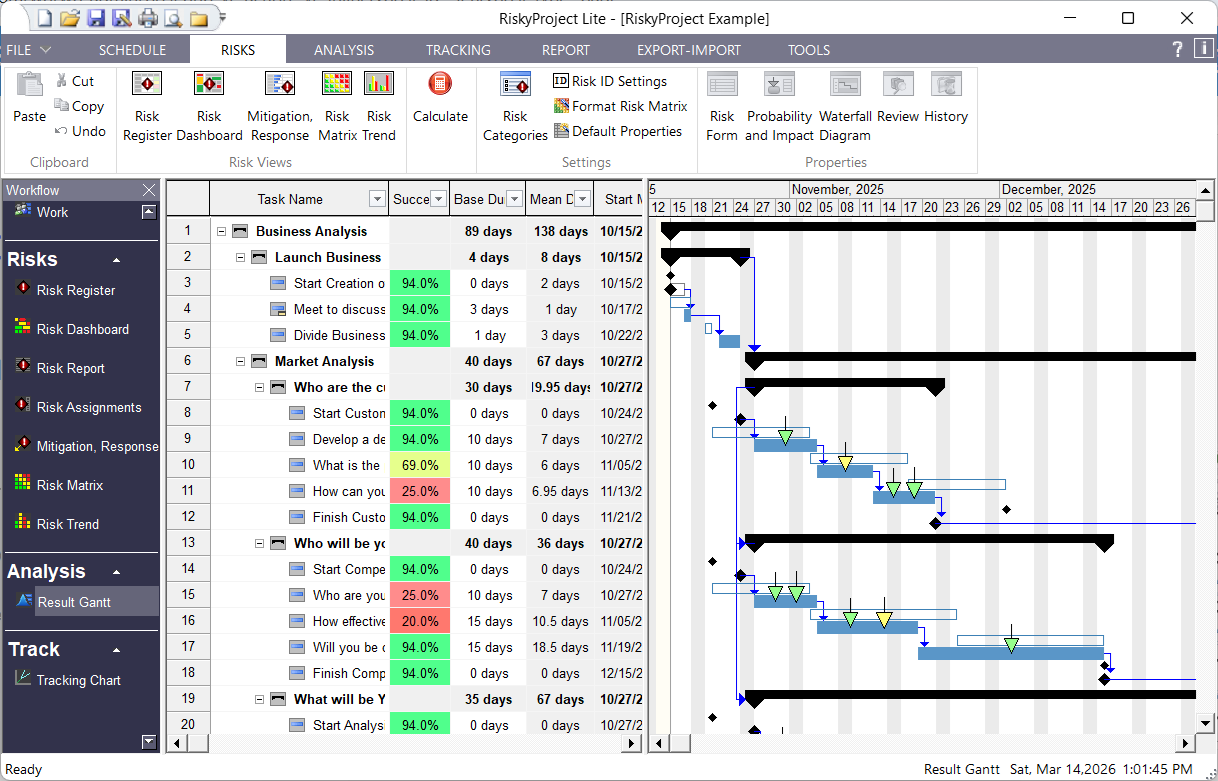
The results of your project risk analysis are shown on the Results Gantt chart. You will see the ranges for start and finish times of each task, and be able to compare them with baseline or original project schedule.
The RiskyProject scheduling engine is designed and optimized for risk analysis. Probabilistic calculations with multiple simulations are performed quickly: on small projects, the calculations are instantaneous. This is important, for as new information about the project performance becomes available, you can quickly reanalyze the project as often as required.
Optimistic (low) and pessimistic (high) risk adjusted project schedule generated as a result of Monte Carlo schedule risk analysis can be displayed separately on Result Gantt chart. It gives you an opportunity to analyze different project scenarios.
Deadlines
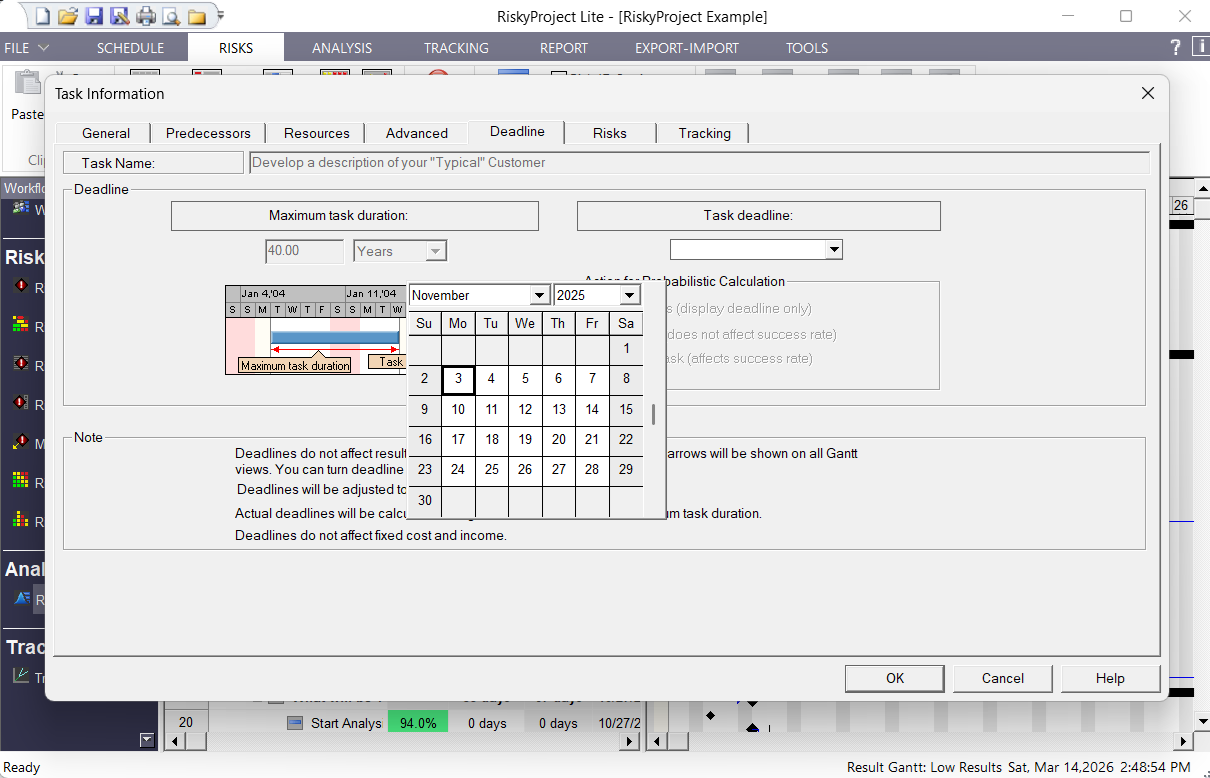
RiskyProject allows you setup task deadlines and assign different actions to them. For example, tasks can be canceled if the task or reaches the deadline. In this case, the success rate of the task (chance the project or task will be completed) is reduced.
Tracking Projects
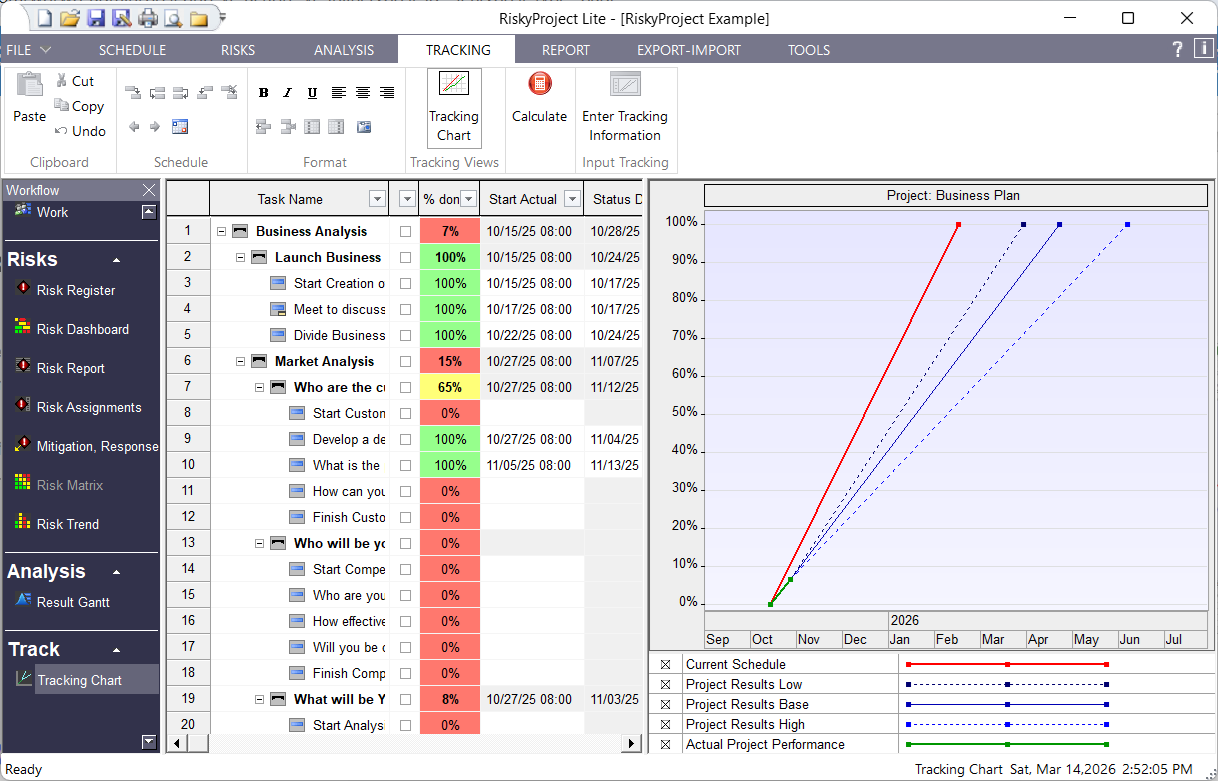
Because real-life data is sometimes the only way to assess your uncertainties correctly, tracking is one of the most important components of RiskyProject. To track a task, you enter the percentage of the task done on the particular date. As part of schedule risk analysis RiskyProject then calculates the projected task duration and updates the risk profile of the task. The project schedule is recalculated to give you a more accurate estimate of total cost, project finish time, and duration.
Reporting Results of Qualitative and Quantitative Risk Analysis
Risk Dashboard
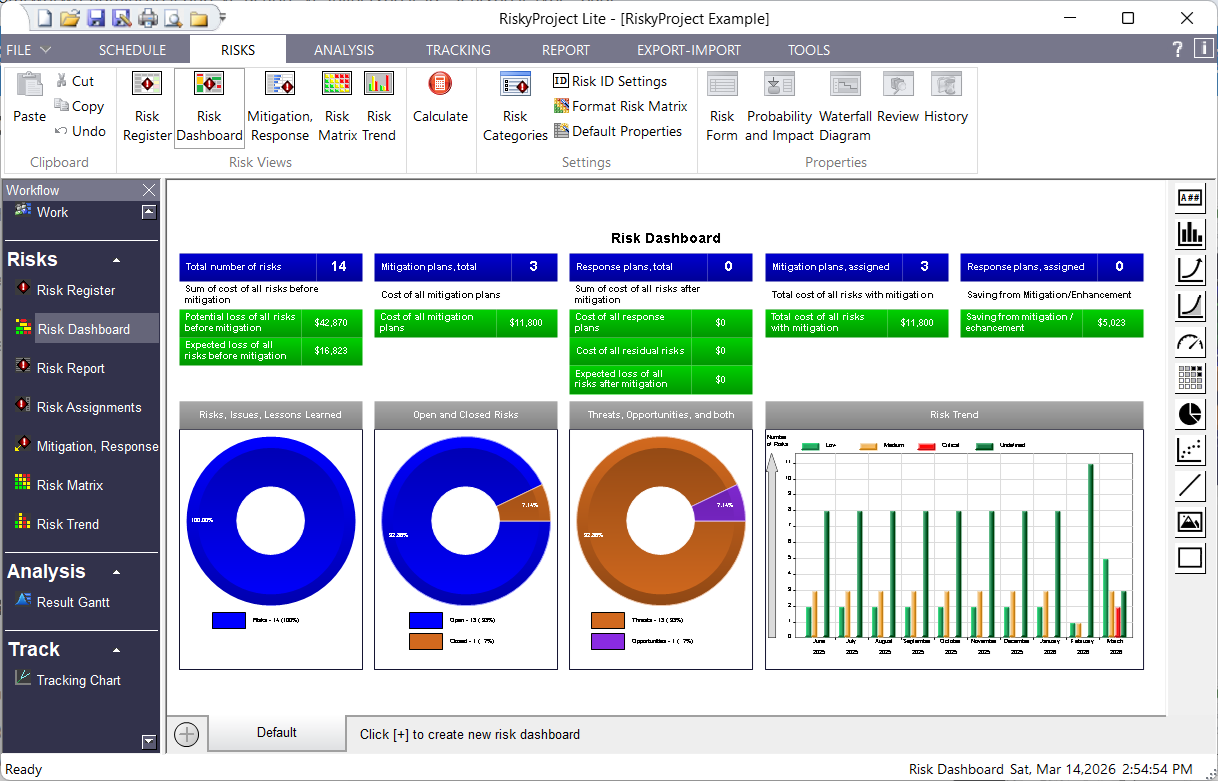
Risk Dashboard presents hundreds of different key performance indicators (KPIs) and charts related to your risks with a fully customizable Risk Dashboard. Dashboards can present data in a variety of ways including charts – line, area, pie, scatter, bar (including frequency histogram), meters, and risk matrixes. You can place them in different areas on the dashboard, and adjust their size, colors, and other properties. Dashboards can be annotated using text, lines, and images. Dashboards can be printed or exported.
Statistics Report
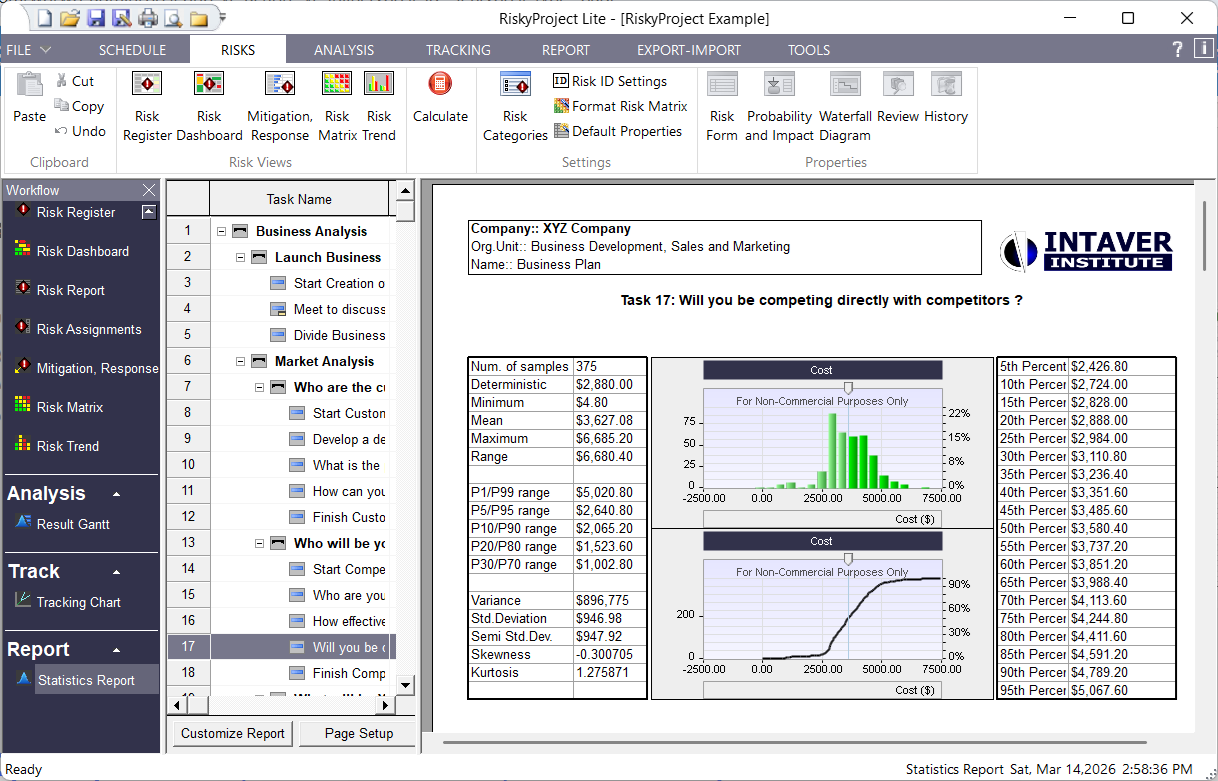
Once you have completed the Monte Carlo simulation, you can quickly generate a statistics report for selected tasks in your project schedule. The statistics report can include histograms for Start Time, Finish Time, Duration, and Cost as well as a Sensitivity to Finish Timetable with a Tornado chart. Statistics reports can be exported to PowerPoint.
RiskyProject Lite, Professional, and Enterprise
RiskyProject Enterprise is a portfolio risk management software. RiskyProject Professional features advanced risk analysis functionalities: project planning, scheduling, quantitative risk analysis, and project performance measurement. RiskyProject Lite has the same project scheduling and performance measurement functionalities, but it includes only basic quantitative risk analysis functionalities.
| Features | Lite | Professional | Enterprise |
|---|---|---|---|
| Project and Portfolio Planning and Scheduling | |||
| Portfolio time, cost, and risk management | x | ||
| Portfolio hierarchy and portfolio Gantt Chart | x | ||
| Work breakdown structure for individual projects | x | x | x |
| Gantt Chart for individual projects | x | x | x |
| Resource and work management | x | x | x |
| Project cost management | x | x | x |
| Constraints and deadlines | x | x | x |
| Multiple baselines | x | x | |
| Multiple project, task, and resource calendars | x | x | x |
| Risk Management | |||
| Risk Register (risks and issues, threats and opportunities, open and close risks, risk properties, risk probabilities, impacts, and scores, search and filter risks based risk properties) | x | x | x |
| Schedule and non-schedule risks (schedule, cost, safety, quality, environment, technology, legal, etc.) | x | x | x |
| Risk Matrix and Risk Trend charts | x | x | x |
| Risk reviews and risk history | x | x | x |
| Documents associted with Risks | x | x | x |
| Mitigation and Response Plan Registry, Risk mitigation (“waterfall”) diagrams | x | x | x |
| Customizable Risk Dashboard | x | x | x |
| Share Risk Register among different projects | x | ||
| Common risk register accessible by different users with an organization | x | ||
| Rank projects within a portfolio based on risks, portfolio and project risk profiles | x | ||
| Customizable risk categories and outcomes | x | x | x |
| Easily assign risks to tasks or resources | x | x | x |
| Risk correlations | x | x | x |
| Risk templates (standard risk templates are included) | x | ||
| Types of Uncertainty | |||
| Risk events for tasks and resources (fixed or relative delay, fixed of relative cost increase, Task restart, End task, Cancel task, etc.) | x | x | x |
| Multiple statistical distributions for task duration, cost, income start time, and lags (Uniform, Triangular, Normal, Lognormal, Exponential, Rayleigh, Gumbel, Beta, BetaPert, Discrete, Custom, and others) | In MS Project Add-in | x | x |
| Conditional branching (If-Then-Else analysis) | x | x | |
| Probabilistic branching | x | x | |
| Probabilistic and weather calendars | x | x | |
| Quantitative Risk Analysis | |||
| Monte Carlo Simulations | x | x | x |
| Global risks (for all tasks or resources) | x | x | x |
| Local risks (for selected task or resource) | x | x | x |
| Cost analysis with risks and uncertainties | x | x | |
| Analysis of success rate using project and task deadlines | x | x | x |
| Risk analysis for product lifecycle management | x | x | |
| Sensitivity analysis (analysis how uncertainties affect project duration, cost, finish time, and success rate) | In MS Project Add-in | x | x |
| Analysis of risk mitigation using multiple baselines | x | x | |
| Reporting Tools | |||
| Customizable histograms and cumulative probability plots for task or project duration, start and finish times, cost, work, resource allocation, income and revenue | In MS Project Add-in | x | x |
| Project information views (view original project parameters and results of simulation) | x | x | x |
| Custimizable Project Dashboard | x | x | |
| Result Gantt view (compare original project schedule with results of analysis) | x | x | x |
| Optimistic and pessimistic project portfolio view | x | ||
| Customizable risk report | x | x | x |
| Report Views: Cash flow, Critical risks, Crucial task, success rate, and others | x | x | |
| Integration with other project management tools | |||
| RiskyProject Add-in for Microsoft Project | x | x | x |
| Integration with Oracle Primavera | x | x | x |
| Other Project Management Software*. | x | x | x |
| Project Control with Risks and Uncertainties | |||
| Forecasting of duration of incomplete tasks with risks and uncertainties | x | x | x |
| Project tracking views | x | x | |
| Other features | |||
| Secure access to the corporate database | x | ||
| Email notification about changing of risk status | x | ||
| User management: multiples users with different roles and permissions | x | ||
| Free unlimited customer support via email | x | x | x |
| Online help and tutorial | x | x | x |
| * third-party software should be purchased separately | |||