

In project portfolio management, balancing risk and reward is a critical objective, especially for organizations aiming to maximize returns while minimizing uncertainty. A powerful visualization tool for this is the Risk Bubble Chart, which helps project managers assess and align risk tolerance with investment opportunities.
Real-World Scenario: Balancing High-Risk vs. Low-Risk Opportunities
Imagine two investment options: a Zambian startup, Eletrocow, promising low-cost artificial milk via fusion-powered artificial cows, or a 300-year-old U.S. company, Shovel and Axe, known for steady shovel and axe production. Eletrocow offers a small chance of massive returns, appealing to high-risk-tolerance investors dreaming of dairy mogul status. Conversely, Shovel and Axe provides a high probability of modest, stable gains, suiting a conservative approach. Your portfolio’s risk tolerance—whether aggressive or cautious—should guide your choice, ensuring alignment with organizational goals.
Decoding the Risk Bubble Chart
The Risk vs. Duration/Cost Chart visually maps this balance. The horizontal axis represents risk (e.g., project standard deviation, maximum/minimum values, ranges, percentiles, or risk scores), while the vertical axis denotes duration or cost. Each bubble symbolizes a project, with size reflecting its cost, duration, or risk magnitude. This chart, integral to tools like RiskyProject, enables a clear view of risk distribution across your portfolio.
Achieving a Balanced Portfolio
In an ideal portfolio, projects exhibit similar relative risk levels, promoting stability. However, outliers demand attention:
- High-Risk Projects: If a project’s risk exceeds peers (e.g., Eletrocow’s volatility), flag it for deeper analysis to mitigate potential overruns.
- Low-Risk Projects: If a project (e.g., Shovel and Axe) shows lower risk, it may absorb additional cost or schedule risk to offset higher-risk initiatives, optimizing resource allocation.
Practical Application
Use the Risk Bubble Chart to identify imbalances, adjust project priorities, and simulate outcomes with Monte Carlo analysis. This ensures your portfolio reflects your risk appetite, enhancing decision-making and project success.
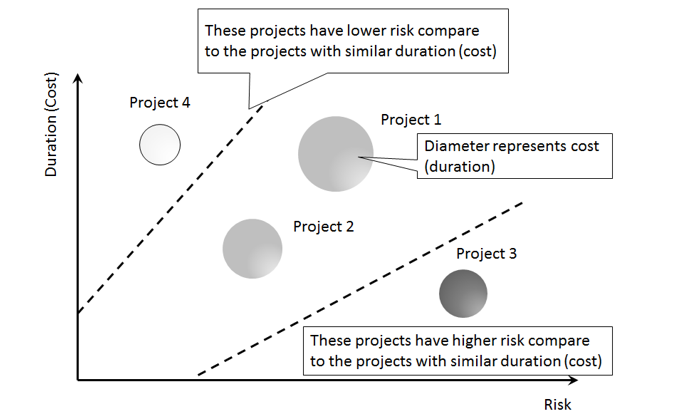
Risk vs. Duration/Cost bubble chart