


Let’s assume that we have a residential construction project. The project might be delayed due to permitting. If the permits are delayed, our project may be delayed and cost more money. We have several of options, we could accept the risk and cross our fingers and hope it doesn’t happen. We could choose a mitigation strategy: hire a consultant to assist with the permitting process, but this will cost money. Finally, we could execute a response plan if the risk occurs, which will also have costs associated with it. In any case, this risk can affect a number of tasks and resources and our best course of action before we decide anything is to compare the different scenarios. Now you have three scenarios:
- Accept
- Mitigate
- Response.
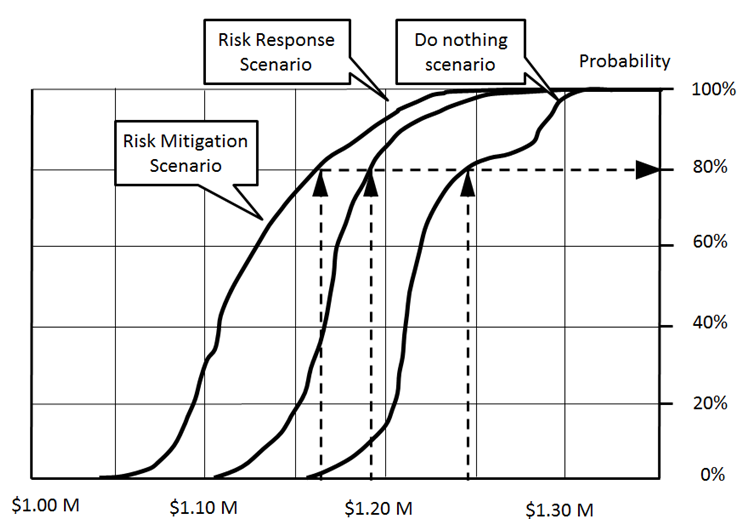
We can perform Monte Carlo schedule risk analysis on each scenario. These scenarios must include any other risks and uncertainties that can impact the project as all of them will contribute to the statistical distribution for project cost and duration. The results of the simulations can be presented in different forms, but we prefer using multiple cumulative probability plots (S-curve). Using on results of analysis, you can estimate cost of each scenario based on certain confidence level (80% in our case) and then choose the best a course of action. In this case you use an indicator “project cost” and select risk mitigation scenario. Also S curves give a very good idea what would be the riskiest scenario: than wider the curve than more risky scenario is.
Scenario analysis helps to identify the effectiveness of the different options. Since mitigation and response efforts affect multiple tasks and resources, we need to calculate the entire schedule with and without mitigation and response efforts and compare different indicators including cost and duration. Project risk analysis software may offer some features that facilitate this comparison. For example, we can save the scenarios as baselines with mitigation plans and without mitigation plans and compare their costs.
We can also rank risks using scenario analysis as each risk in each scenario will have a risk score. It is also possible to isolate the impact of a risk on the project by running two simulations, one with the risk open and the other with the risk closed or disabled. The difference between the two would show the actual cost and delays caused by the risk. Repeat this process with all of the risks and we get a ranking of risks based on the calculated cost or delay caused by each risk. While this method does appear to provide more precision, it also is more time consuming. If you do require a cost of risk, it may be the effort. However, if you are simply looking to rank your risks, the method of risk ranking based on correlation described in Chapter 9 is more than adequate.