


What is Risk Matrix?
A risk matrix is a project management tool that allows a single page – quick view of the probable risks evaluated in terms of the severity or impact or risk and likelihood or probability of the risk plotted the x and y axis. Risk matrix usually has cells associated with different ranges of probability and impact.
How to Use Risk Matrix?
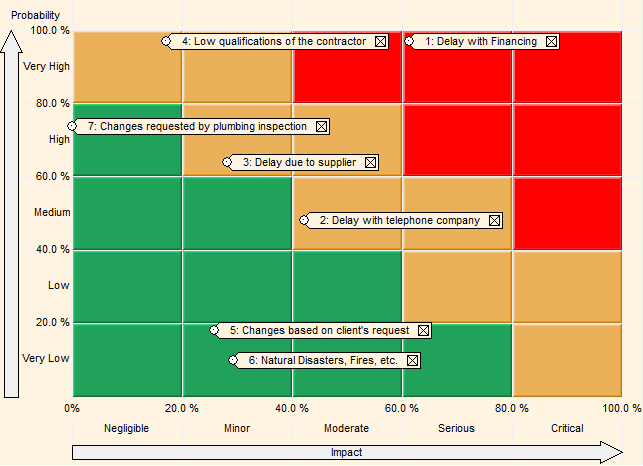
Risk Matrixes are used to assess risk severity based on where the risk’s assessed probability and impacts intersect on the risk matrix. Commonly, on a risk matrix each row and column is assigned a numeric value from 1-5 (on a 5×5 matrix) with one being the lowest and five being the highest The risk score is calculated is the probability score multiplied by the impact score. For example a risk with a probability of 4 and impact of 4 would have a score of 4 x 4 = 16. Risk severity is often visualized using a heat map the overlays the matrix, with cells with risk scores that are critical red, medium in yellow, and low in green. The heat map provides a quick visual assessment of risk criticality and assists in the prioritization of risk response handling. For example risks in red cells should be avoided, risk in yellow cells should be mitigated, and risks on green cells can be accepted.
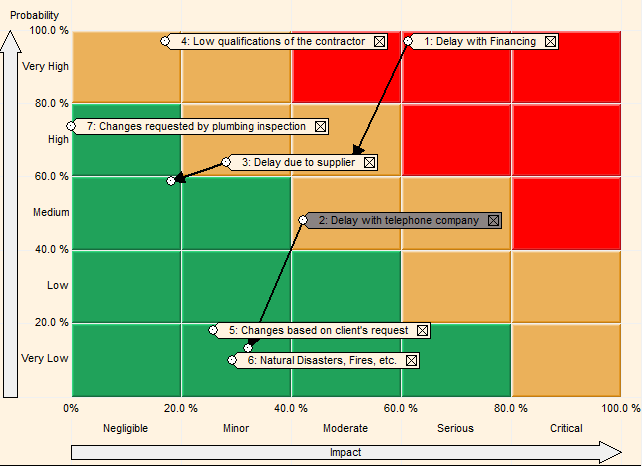
Risk matrix may include arrows, which represent probability and impact of risk after mitigation. It is also possible to changes in risk probability and impact during the course of the project.
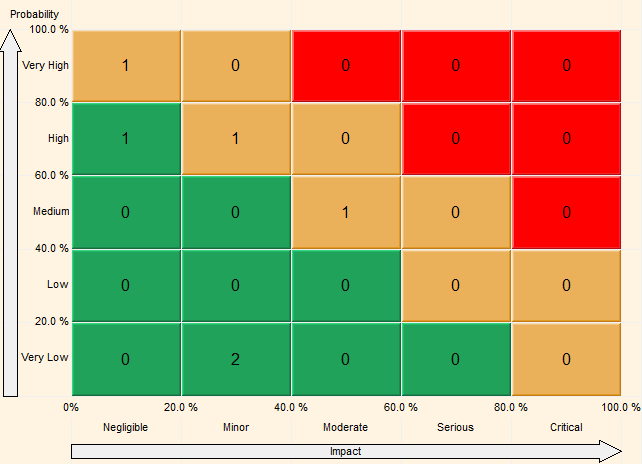
It is also possible to show total number of risks associated with each cell of risk matrix.
How to Create Risk Matrix
Risk matrixes can be setup up for an entire organization or for a specific program. Here are the important parameters of the risk matrix that must be defined:
- Number of intervals for probabilities and impact. How many rows and columns will it have?
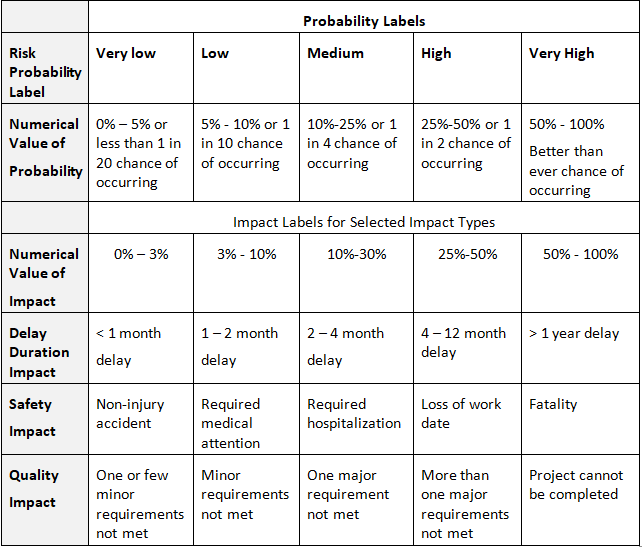
- Probability and Impact labels and numerical value of each interval. The label of interval will be shown on risk matrix, but it can be used when you when you enter probabilities and impacts for a certain risk belonging to certain impact type. Below we have an example of probability and impact numerical scales and labels for selected impact types:
Please note a few important things about risk matrixes:
- You should define and name intervals separately for threats and opportunities. For example, the safety interval definition requiring hospitalization may not be suitable for opportunities (unless this is Department of Defense project related to the outcomes of battle tactics). As a result, an organization may need to define many interval names for multiple objectives, for impacts and probabilities, and for threat sand opportunities. However, you only have to do this once and it can be used for all of our projects. In addition, you can use the overall rank indicators for objectives that don’t require specific intervals.
- In many cases, the intervals for numerical scales are nonlinear. In particular, higher impacts are associated with larger intervals. For example, if you travel from Boston to New York and you delayed on 30 min it may be acceptable, however it you delayed on 1, 2 or more hours, it is a serious impact to your schedule, and you should avoid such risks.