

Project risk analysis with RiskyProject: Introduction to RiskyProject software
The video provides an overview of the basic workflow of RiskyProject: a project risk management and risk analysis software.
RiskProject is a project risk analysis and management software that allows users to perform schedule and cost risk analysis and project risk management in one integrated software. In addition to providing a tour of the software’s interface, the demonstration quickly goes over how to assign risk events to project cost and schedules as well as uncertainties on a simple project. After running a Monte Carlo simulation, the results of simulation are shown including the main statistical charts: histograms, cumulative probability plots, and tornado charts (sensitivity analysis).

Project Risk Management and Risk Analysis Workflow
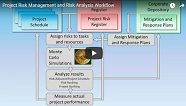
Project risk analysis and risk management workflow implemented in RiskyProject includes risk identification, qualitative and quantitative risk analysis using Monte Carlo simulations, and project control. Project risk analysis is performed based on risks defined in the risk register. Risks from risk register can be shared among whole organization.
Introduction to RiskyProject Enterprise – Enterprise risk management and risk analysis software
This is an introduction to RiskyProject Enterprise – project portfolio risk management and risk analysis software. In this video, we will show how you can use this to analyze and manage your organizations risks at either a portfolio, program, or project level. RiskyProject Enterprise combines portfolio risk management and Monte Carlo risk analysis in one integrated system. In RiskyProject Enterprise Risk register is stored in the database and can be shared in the organization. Each risk can be assigned to different projects or programs and within a project to different tasks and resources. Use RiskyProject Enterprise to manage risks across your organization.

Project Risk Analysis with Microsoft Project
This video is a quick overview of how to use project risk management and risk analysis addin in Microsoft Project. The RiskyProject addin allows you to perform schedule and cost Monte Carlo analysis as well as project risk management directly from Microsoft Project 2010 and later versions. Watch this video to see how using the risk analysis addin, you can quickly and easily run Monte Carlo simulations on your project schedules. The video shows a quick step by step process on how to set up your Monte Carlo calculation settings, add risks and uncertainties to your project activities, and generate common project risk reports (histograms, cumulative probability, sensitivity, and scatter plots). RiskyProject offers an easy-to-use environment to perform risk analysis directly in Microsoft Project.

Schedule risk analysis with RiskyProject: How many Monte Carlo iterations are required?
This video tackles a common question that we get from users of our schedule risk analysis software RiskyProject. How may iterations do you need to do in Monte Carlo schedule risk analysis to get accurate results?
In fact many users believe that they are required to run 1000s of iterations during the Monte Carlo simulation to ensure the quality of their schedule and cost risk analysis. Depending on the size and complexity of the project, number of resources, costs, risks, etc, this can take a lot of time and computer resources.

As we shall see, using a simple example and examining common statistical measures, users do not need to run as many iterations for Monte Carlo schedule risk analysis as common believed to calculate valid results. Moreover, the video will show that perhaps, concerns about how the number of iterations impacts the validity of the results is misplaced and really the greater emphasis should be placed on ensuring the quality and accuracy of the input data as this has a larger potential to negatively impact the risk analysis than the number of iterations.
Project schedule risk analysis: How Monte Carlo Works
The video show basic concepts behind Monte Carlo project schedule risk analysis. Based on example of very simple project schedule this video demonstrates Monte Carlo sampling process. The video also shows basics steps of Monte Carlo simulation for the precedence network.
The results of a Monte Carlo schedule risk analysis can be thought of as a risk adjusted project schedule. Risk adjusted project schedules can be created using mean duration, start and finish time, or a particular percentile of statistical distributions for start, finish time, and duration. It is very convenient to show a risk adjusted project schedule alongside the original deterministic (no uncertainties) project schedule. Both schedules can be shown on a single Gantt chart.
Monte Carlo offers a universal method to analyse your schedule. It does not matter what combination of tasks you have and what distributions they have, Monte Carlo will be able to calculate an accurate, if probabilistic, answer.

Schedule risk analysis with RiskyProject: What statistical distribution should you use?
This video will discuss a common question that we receive from the users of our project risk management software RiskyProject? What type of statistical distribution should we use? When performing Monte Carlo schedule or cost risk analysis, one of the choices you must make is the type of statistical distribution to apply to your 3 point estimates: Low, Most Likely, and High cost, duration or other parameters. This selection can be somewhat confusing as RiskyProject has multiple statistical distributions from which to choose and users are unclear regarding what impact different statistical distributions will have on their analysis.

In the video we will look at the results using two statistical distributions that are commonly used for risk analysis using standard statistical measures to see how they impact the results of the analysis. As we will show, in the vast majority of cases the selection does not make much of a difference on the results and users should default to a triangular distribution unless there are compelling reasons to select another.
Project Risk Management in Oil and Gas Industry: Why Now
In light of recent drop in oil prices, improving efficiencies of oil and gas exploration, development and production has become very critical. Project risk management is proven to be perhaps the most cost effective and easiest to implement method to improve project performance and reduce cost. Still many oil and gas companies do not employ effective project risk management processes. This video demonstrates the basic steps of project and portfolio risk management process:
– Identify project risks and record them in risk register
– Assign risks to different projects and activities and calculate impact of these risks on project
– Reduce the impact of project risks
– Manage and control risks during a course of projects
")
Project risk analysis with RiskyProject: risk correlation
The video shows what is risk correlation and how to use it in schedule and cost risk analysis.
RiskProject includes risk correlation feature. Risks assigned to activities within a project schedule can be correlated with each other. For example, one risk can trigger other risks, or different risks can occur at the same time. In RiskyProject you can define correlations of different risks or the same risk assigned to different activities. Risk correlation can significantly affect result of risk analysis.

Managing Risks in Project Portfolio using RiskyProject Enterprise: Risk Visibility
This video covers how the risk approval process is implemented in RiskyProject Enterprise – project and portfolio risk management and risk analysis software. The risk approval process is enabled using risk visibility and user roles. When a user identifies a risk and assigns it to a project, it can be shared with other projects using risk visibility. Risk visibility defines in which sections of the portfolio the risk is available. If a risk is available and can affect a project, the project manager can then assign it to the project with probability and impact as part of the risk assessment process. In this way a risk that is common to multiple projects in the portfolio can be assessed and managed at any level of the portfolio hierarchy.

Monte Carlo Schedule Risk Analysis. Part 1: Introduction to schedule risk analysis techniques
Video shows how schedule risk analysis is performed in RiskyProject project risk management and risk analysis software. Monte Carlo simulations require inputs to perform the analysis: duration estimates and statistical distributions. In this video, we describe what a statistical distribution for schedules is and use a real life example to gather the distribution data and describe them using frequency histograms and cumulative probability plots. Finally, we use the data we generated from this real life example, to create a risk analysis model in the software and run a Monte Carlo simulation.

Monte Carlo Schedule Risk Analysis. Part 2: Basic schedule risk analysis techniques
This video takes you through the basics steps to run a basic Monte Carlo schedule risk analysis in RiskyProject. RiskyProject is project risk management and project schedule risk analysis by Intaver Institute Inc.
Taking a basic schedule of five activities, we show how we add low and high estimates to both a single and a group of activities and then select a statistical distribution, in this case triangular. Once the risk model of the project schedule is set up, we show how to run the simulation. When the simulation is complete, the basic histograms and cumulative probability. Finally, we take a quick look at the sensitivity analysis, which is visualized as a Tornado chart that shows which activities and their parameters (duration, finish time) to which the project is most sensitive.

Monte Carlo Schedule Risk Analysis. Part 3: Why go through Monte Carlo schedule risk analysis
This video shows how to use RiskyProject project risk management and risk analysis software to create realistic risk adjusted project schedules.
We often asked the question, why go through Monte Carlo schedule risk analysis. What can it reveal to a project manager that critical path methodology (CPM) does not. In real life projects can have multiple possible critical paths, and this most important when you have several parallel activities that link to a single successor. For example, you may have many components that have to be developed before you can assemble and test a prototype. In your original schedule, you have identified the activity with the longest activity as being on the critical path. But in reality, depending upon risks and uncertainties associated with the activities, any of them have a chance of taking longer than expected and becoming critical. In this video, we use a simple example and show how in a probabilistic analysis using Monte Carlo that because of the this phenomena, your original estimate to complete all of these activities is not realistic and should be adjusted to account for this.

Monte Carlo Schedule Risk Analysis. Part 4: The Portfolio Effect
The video demonstrates Portfolio Effect using RiskyProject project risk management and risk analysis software. One often overlooked phenomena in project schedule analysis is the how the Portfolio Effect is expressed when you have a network or right-skewed distributions. Normally, the statistical distributions used to model schedule activities are right-skewed. This is because while we can improve somewhat on the most likely duration estimate if everything goes well, the duration can increase far more, theoretically a task could take an infinite amount of time if everything goes terribly wrong. This create a right skewed distribution with a characteristically long tail to the right. When you perform a Monte Carlo simulation on a series of uncertain elements the outcome range of the resultant distribution tightens around the sum of the means. In right-skewed distributions, the mean is higher than the P50, therefore the results of the sum of the project activities move to the right and therefore are more likely to take longer.

In this video, we create a simple schedule of 10 activities with typical schedule durations and show how the Portfolio Effect will move the most likely finish significantly later. If this is not accounted for in the estimate, your forecasted project finish date will be much more difficult to meet.
Integrated Cost and Schedule Risk Analysis
Often in projects the cost and schedule estimates are not aligned. This can cause significant variances from the baseline due to time-dependent cost. Time-dependent costs are modelled using resources with rates ($/unit of time) assigned to activities with duration. If the duration increases due to risk, the so does the resource costs. By using a resource loaded project schedule, you can generate more accurate risk adjusted cost estimates.

Project risk analysis with resources
In projects, materials and personnel can be a major source of cost and schedule risk. This video gives a quick overview of how to assign risks to project resources and shows how they can affect your project schedule and cost analysis.

Cost Risk Analysis
This video covers how to run a basic Monte Carlo cost risk analysis on fixed cost. In the example we use a single activity with a Base fixed cost. The first method involves adding Low and High estimates and a triangular distribution to generate probabilistic results. In the second method, we show how to assign a risk with a cost impact to the the activity and run a cost risk analysis.

Project Risk Analysis: Assigning risks to your schedule and costs
The alternative method for Monte Carlo risk analysis (as opposed to applying uncertainties) is to assign risks from your risk register to your project schedule and costs. RiskyProject has an integrated risk register that allows you to assign risk outcomes – probabilities and impacts – to your project, which we refer to as Event Chain methodology.

This is the preferred method of quantitatively assessing risk in projects especially in circumstances where you have limited analogous historical data that can be used for risk estimates. The reason for this is that people generally have very limited ability to estimate at the boundaries or limits of the uncertainties. Whereas, we can be quite accurate at estimating what the most likely duration will be, we do much more poorly when attempting to estimate worst case and best values. The result is that we end up with unrealistic and generally too optimistic estimates for our projects.
Using risks to model project uncertainty will generally lead to better forecasts as people are much better at understanding how a risk will impact a project if it occurs.
Configuring your Risk Register: Risk Categories
RiskyProject includes an integrated risk register and it is a very important component its project risk analysis and risk management capabilities. However, before you start using RiskyProject, you can modify the default risk register set up to meet the specific needs of your project and organization. In this video, I will quickly go over how you can add, delete or modify risk categories. This is important in that the rule as little “as possible, as much as necessary.” You don’t want to have your risk register cluttered up unnecessarily, so we recommend that you keep only those categories that are necessary.

Configuring your Risk Register: Risk Properties
A key to managing your risks is recording the who, what, when, where etc. These are risk properties and are used as part of the management and reporting of the risks. Properties such as who reported the risk, when was it reported, external or internal, are all common properties that should be captured during the initial identification as well as ongoing monitoring and control. This video will show you how to add, delete or modify the risk properties.

Creating Mitigation Plans in RiskyProject
This video guides you through the process of creating a risk mitigation plan in RiskyProject. RiskyProject has a complete risk analysis and management system, which includes risk planning including mitigation plans, risk mitigation waterfall charts, and a cost of risk workflow that provides a quick cost benefit analysis of the proposed mitigation plans. You will learn how to add mitigation plans, assign them to a risk in the waterfall chart and see how the cost of the mitigated risk is calculated.

Mitigation Planning and Scenario Analysis
Risk analysis will not only tell us how critical are certain risks, but also what is the most effective way to minimize the impact of these risks on your project. Some mitigation plans can cost more than others and significantly increase duration of the project. One of the way to determine efficiency of mitigation plans is perform risk analysis with multiple scenarios. Scenario analysis is useful for selecting optimal project strategies.