

Project risk scores are essential tools in project management. They quantify and rank the potential impact of risks—whether related to time, budget, or other categories like safety or quality—helping teams make informed decisions throughout the project lifecycle. But not all risk scores are created equal. Calculating them from qualitative or quantitative analyses can sometimes produce misleading results if not done correctly. That’s why it’s recommended to assess risk using three distinct scores:
- Project Duration Risk Score
- Project Cost Risk Score
- Non-Schedule Risk Score (e.g., safety, security, quality)
How to Calculate Risk Scores
For duration risk score compares the mean project duration (accounting for risks) against the original, baseline duration:
Duration Risk Score = Duration Mean / Duration Original
- If score = 1, there are no schedule-related risks
- If score > 1, the project is threatened by delays
- If score < 1, there are schedule-related opportunities (e.g. completing ahead of time).
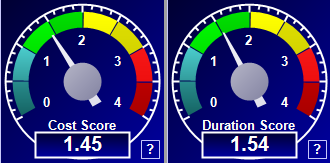
Cost risk score is calculated similar way. The risk scores are displayed in RiskyProject software using the meters:
How to Calculate Non-Schedule Risk Scores Using Monte Carlo Simulation
- Simulate Risk Impacts: For each project risk category, build an array of cumulative impacts rom simulation runs.
Example: Two risks under “Quality”—installation (50% chance, 30% impact), manufacturing (20% chance, 40% impact)
Here are results from 10 Monte Carlo iterations: 0%, 70%, 30%, 0%, 40%, 0%, 30%, 30%, 30%. - Compute Mean (average) Impact
- Apply Weighted Factors: Multiply each mean impact by the weight assigned to its risk category.
- Aggregate & Normalize: Sum the weighted impacts to generate the absolute non-schedule risk score for each project. This normalization ensures consistency across all risk categories—duration, cost, and others. Here are the results:
- Score = 1 → no risks
- Score < 1 → net opportunities
- Score > 1 → net threats
Final Thoughts
Using separate scores for different risk categories provides transparency and improves decision-making. While methods like Monte Carlo simulation and statistical modeling add rigor, the key lies in using a consistent framework to compare risks across projects.