


Why Cost Risk Analysis
In last few years, the world has experienced a technology revolution that many people are either unaware of or did not appreciate its implications: shale gas production techniques. From 2014 to 2019, oil production in the US has increased by more than 40%. This increase in production placed the US in heady company along with Saudi Arabia and Russia as the leading global producers of oil. How was this enormous growth in US oil production possible?
The world has very significant reserves of oil and gas and our ability to physically extract it has improved immensely: however; this production has to be economical and the main limiting factor is cost. Shale gas and tight oil belong to a category of oil referred to as unconventional oil. Over last 15 years, technologies such as hydraulic fracturing and horizontal drilling have dramatically improved, which allowed producers to reduce the cost of oil and gas per unit of production. In 2019, the average full cycle cost of tight oil production was around $40 per barrel. It could be lower, except for one inescapable issue, oil and gas exploration and production are fraught with many risks and uncertainties. Geology is one of main uncertainties: there is a built uncertainty in how much oil can be produced from a given play, it may not be able to produce as much oil as planned. But uncertainties related to cost of labor, materials and services are also very significant. Oil and gas producers work to ensure that they get as much production as possible for the least possible cost.
Essentially, oil and gas producers’ goal is to complete projects on budget. Project risk analysis will help them to determine the chance that project will be completed on budget and possible ways to manage project risks to minimize cost impacts. But drilling and completion project costs are directly related to project schedules. If you can drill wells in less time, if you can move equipment more quickly from site to site, and if all materials and services are provided on time, all of this will reduce costs. So, we can see that managing project costs and schedules needs to be done at the same time.
Cost Uncertainties
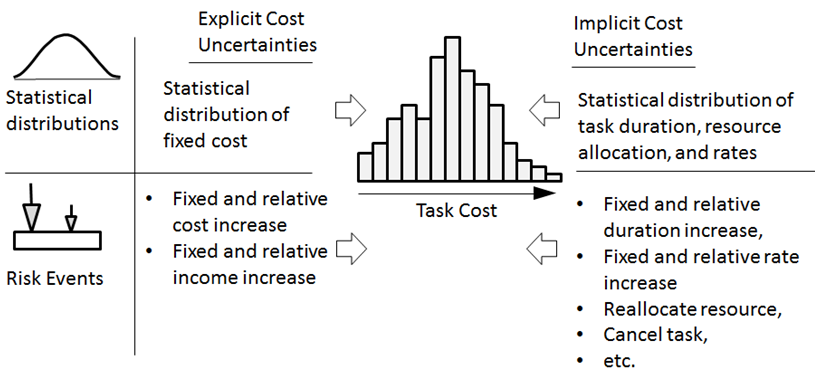
Uncertainties, related to cost could be defined different ways:
- We explicitly define a statistical distribution for the fixed cost of each task. For example, fixed cost of a task is between $3,000 and $4,000 and defined by a Beta statistical distribution.
- Risks may have different impact types related to cost: “Fixed and relative cost increase”, “Fixed and relative income increase”, “Fixed and relative rate increase”, and others. These risk impact types belonged to the category called “Cost and Income”. Risks with these impact types would explicitly define cost uncertainties.
- If we have uncertainties in task duration, rates and resource allocation expressed as statistical distributions, plus we have resources with certain rates assigned to these activities, this would implicitly define cost uncertainties. For example, if a task duration is between 2 to 7 days and the allocated work resource is $1,000/day, the time dependent cost of the task would be between $2,000 and $7,000.
- If we have uncertainties in task duration, rates and resource allocation expressed as risk events, and resources with certain rates assigned to these activities, it would also implicitly define cost uncertainties. For example, if task cost is $2,000, work resource is $1,000/day, and we have risk “Fixed duration increases by 2 days” with a certain probability, the task’s cost would be between $2,000 and $4,000.
In addition, the same risk may have risk impacts related to the “Cost” risk category and the “Schedule” risk category. For example, in oil and gas project risk “Failure to obtain high quality microseismic data” assigned to task “Seismic monitoring for oil drilling” may have two risk impacts:
- Relative duration increase 20%.
- Relative fixed cost increase 15%.
The first one implicitly affects cost uncertainties since some resources are assigned to the task, while the second one explicitly increases task cost. What is true for risks related to duration, is also true for risks affecting cost and income. For example, relative cost increase could be between 10% and 20% and defined by a normal statistical distribution.
Project cost uncertainties
Results of Cost Analysis
Project costs are calculated during each iteration of a Monte Carlo simulation as the sum of the cost of all tasks. All explicit and implicit uncertainties will be accounted for. The results of analysis may include:
- Statistical distribution of task cost, including summary tasks
- Statistical distribution of project cost
- Ranking of risks based on cost: what risks have the largest potential impact on project cost.
The results of analysis can be presented in forms of frequency or cumulative probability plots, or a combination of the two. This chart helps to determine what the chance is that the project can be completed on budget. In this example, there is 75% chance that project cost will be below $100,000.

Statistical Distribution of Task or Project Cost
Cumulative Cost Chart
Results of cost risk analysis can be also presented on a cumulative cost chart. Cumulative cost charts show how project cost increases as s project progresses. The chart may show:
- Cost of projects with risks and uncertainties
- Cost of projects without risks and uncertainties (deterministic cost). It is a useful basis for comparison and quality control of the risk analysis
- Actual project cost.
The chart may also show the difference between deterministic and probabilistic project cost at each moment of time.

Cumulative Cost Chart
So we can see how integrating the project schedule along with resources is integral to a comprehensive cost risk analysis as uncertainties and schedule are a significant driver of cost risk.