

As the saying goes, “pictures are worth a 1000 words”, and therefore dashboards with clear graphics and charts are one of the most effective ways to communicate the results of your risk analysis. To address this, one of the most significant changes in the new version of RiskyProject is the new reporting capabilities offered by the customizable Project and Risk dashboards. The key modifier is the last sentence is “customizable” as the previous versions dashboards were hard-coded. Therefore, while these dashboards provided the “essential” information, they did not have the flexibility to capture the wide range of metrics and visualizations that are available for quantitative and qualitative risk analysis and management. In addition to providing flexibility, the new dashboards allow anyone to create their own reports.
The dashboards use easy to learn controls that allow you to quickly add or modify text, charts, graphs, KPIs, and images to your dashboards. The objects that can be added to your dashboard are located on the right edge of the dashboard. Adding an object is as simple as clicking on the object you want to add and then using your cursor, clicking on the dashboard, and dragging the cursor to the desired size and position. While not unlimited, the dashboards have a wide variety of objects that you can use providing the flexibility that should meet your needs.
The dashboards also come preconfigured out of the box. They can be used immediately or can provide a great starting point for dashboard development. For those who want to start from scratch, you can quickly clear the dashboard and start from a blank slate. And if at any time you want to roll it back, you can reset your dashboard to the default settings.
Let’s look at what is available in detail. KPIs are separated into 6 categories: Risks and their parameters, Number of Risks, Mitigations, and Response plans, Risk Cost, Reviews, Project Related, and Schedule Related. KPIs can be based on individual risks (ranking based on cost, schedule, other or overall impact) or higher level risk information (number, last added, last reviewed, mitigated, last updated, etc.).
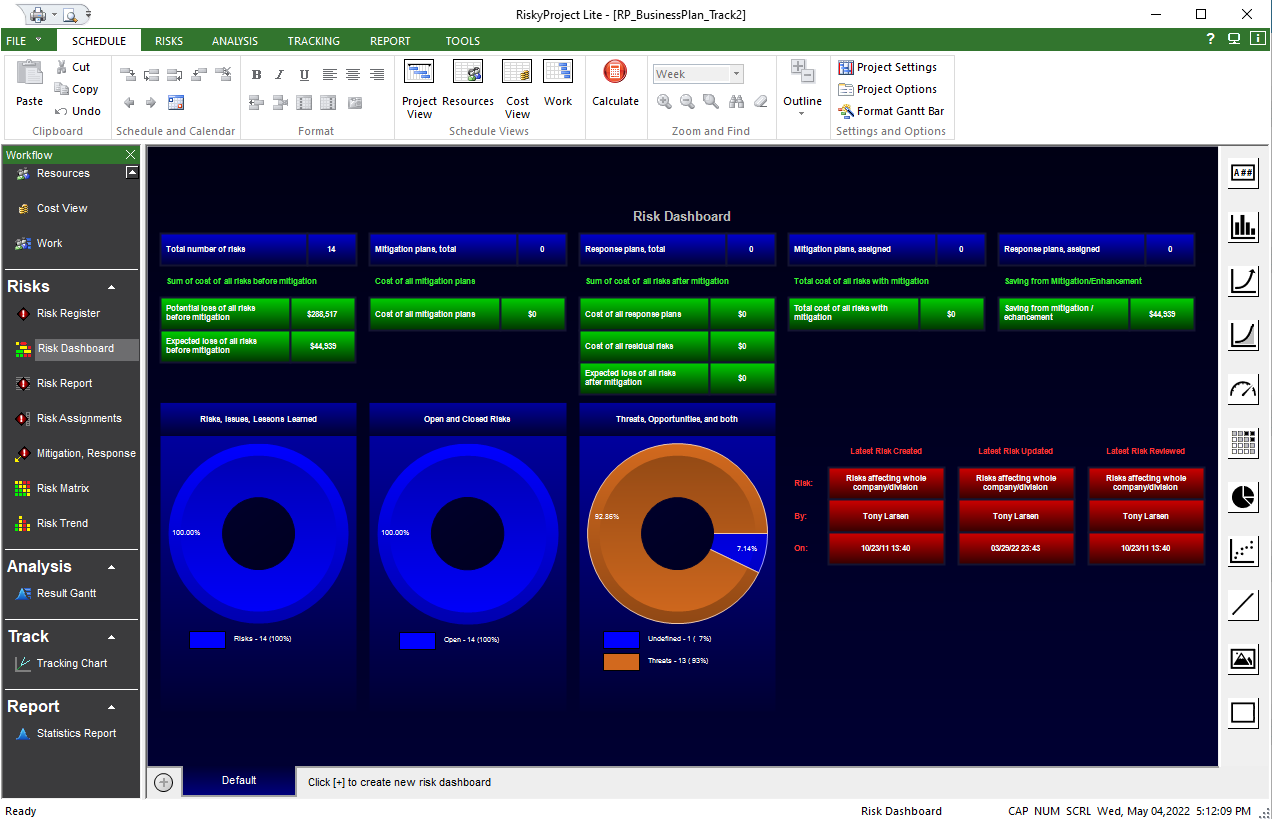
In addition to the KPIs, charts and other visualizations that are part of RiskyProject’s library can be added to the dashboard. These include: Bar charts (risk trends or histograms), Line charts, Area charts, Pie charts, Scatter charts, Meters, and Matrixes. Each of these visualizations have properties that can be modified which include data type, colors, outlines etc.
Once you have added KPIs and charts, you can further customize your dashboard with titles, frames and images such as company or project logos using the Rectangle, Line, and Image controls. Rectangles can double as both frames and text boxes. Lines can be used as separators, pointers, or to underline titles. And finally you can add your company logo or other images to the dashboard.