A number of diagramming techniques are used for risk identification. All these tools can be used as part of risk identification workshop where moderators enter information about risks during discussion and present it to the experts. This can be performed with specialized software of simply paper and pen.
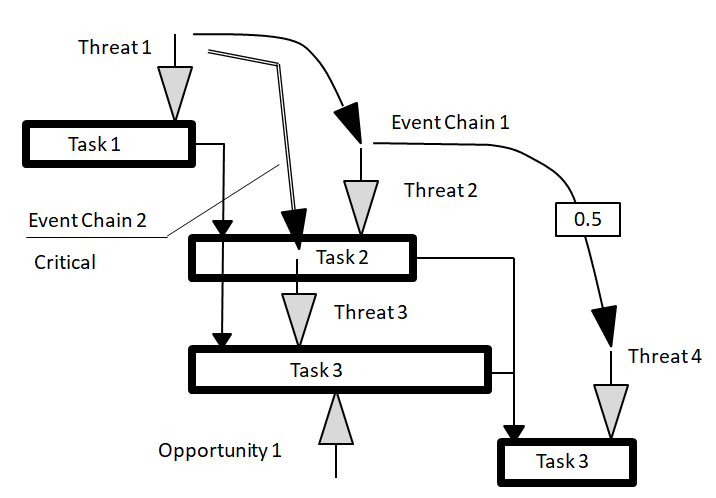
One of the diagramming techniques is called Event chain diagrams, where risks are presented on a Gantt chart. The issue with this technique is that relies on a project schedule that may be not yet be ready for a specific phase of the project.
In an absence of detailed project schedule, it is possible to use flow charts, which show major phases or milestones of the project and relationship between them. It is possible to also use the WBS elements as the basis of this analysis. With these charts, it is easier to identify risks associated with particular project phases, deliverables, or objectives. Flow charts are especially good at showing how branches could impact a project.
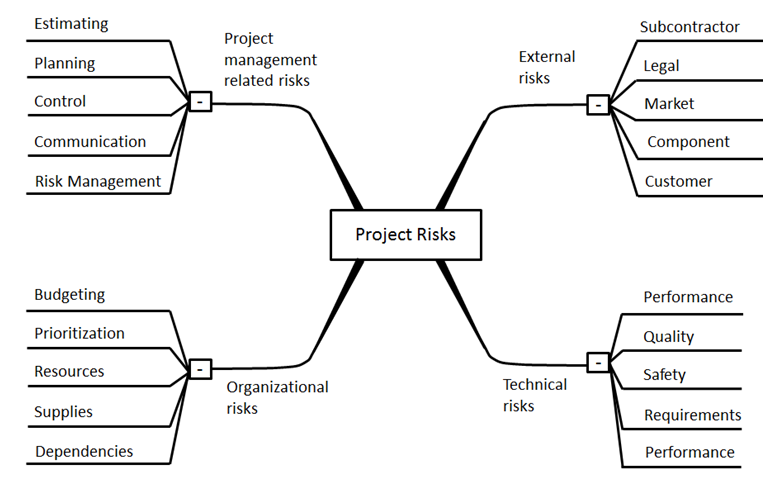
One of the most popular graphic tools for project risk identification has become mind maps. In a mind map, the central theme is often illustrated with a graphic image. The ideas related to the main theme radiate from that central image as “branches.” Topics and ideas of lesser importance are represented as “sub-branches” of their relevant branch.
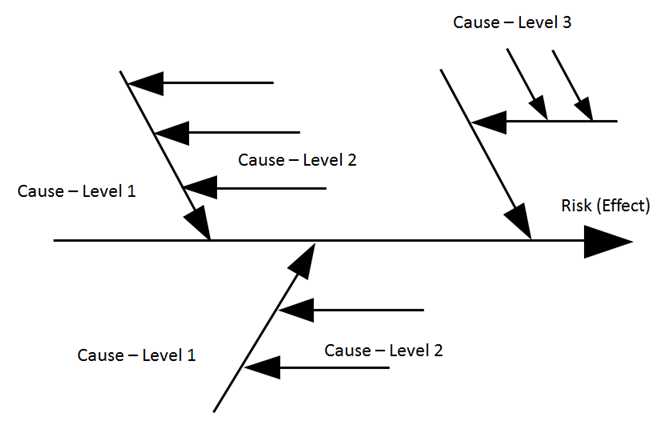
Cause-and-effect diagrams are the brainchild of Kaoru Ishikawa and are sometimes called “fishbone” diagrams. If you are trying to identify the relationship between risks, for example what risk could trigger another risk, you may find cause-and-effect diagrams useful.