

After you have run a Monte Carlo simulation, the unprocessed results are just a series of statistical distributions. To get any real value, we must understand what they mean. One of inherent problems with probabilistic calculations is that they go against our common sense. In real life, if we perform a task there is only one result, but Monte Carlo provides us with a whole range of results (distributions). For example, you are going out for dinner with your friends and tell your babysitter it will take somewhere between 2 and 3 hours. The babysitter asks if you could be a bit more accurate. When you think about your answer, you realize that it could be 2 hours 15 minutes, or it may be 2 hours and 45 minutes or even more. If you would like to provide your babysitter with a more certainty, what would your answer be? Let’s see how Monte Carlo simulations help us answer these types of questions.
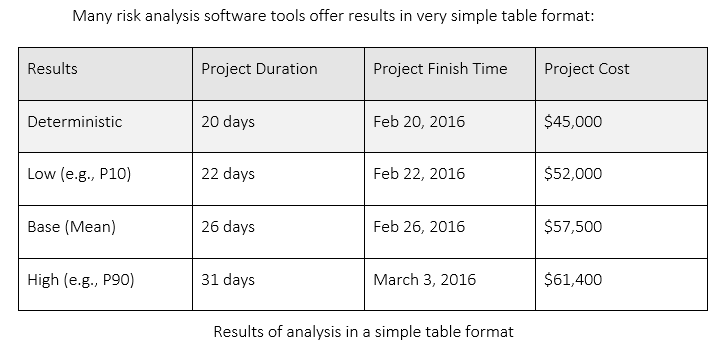
These results are easy to interpret. This table shows that the mean average duration of the project will increase by 6 days and $12,500 due to risks and uncertainties.
The results of analysis can also be presented in the form of frequency histograms and cumulative probability plots. In earlier chapters, we examined how to utilize these charts to determine that chance that the project or task will be completed before certain dates and below certain costs. These charts can also be useful for quality control of the results of your analysis. Please look at the charts below, they represent three very common cases of which you should be aware. In this example, we have used a statistical distribution for cost, but similar cases may occur for duration, work, and other parameters.
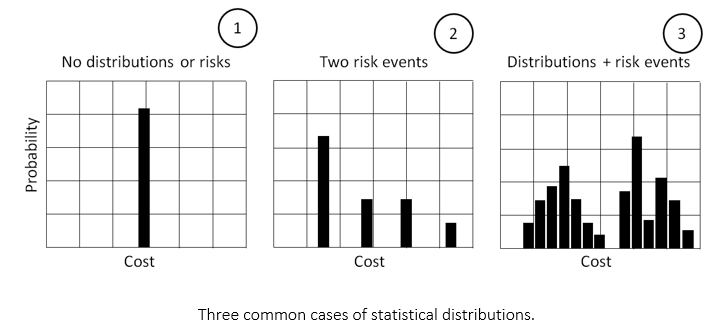
- All costs are the same; there are no uncertainties or risk events affecting task or project cost.
- This task or project has two risk events affecting cost. If there are only two events, why do we have four bars? One of the bars is the original cost (no risks). The second and third bars are costs when the two risks occurred separately. The last bar shows cost when two risks occurred simultaneously.
- Bimodal distribution where we see the interaction of uncertainty and risk events. In this example, the left group is cost uncertainty defined using a statistical distribution. These distributions model the inherent variability that occurs due to small fluctuations that might occur to cost. The right group is the result of risk events impacting cost. These risk events cause significantly greater impact than “noise,” defined by statistical distributions.
Most project risk analysis software applications provide tools for analyzing frequency histograms and cumulative probability plots. We can use sliders or guides to determine the probability that cost, or duration will be greater or below certain values. We can also place lines associated with low, base, and high estimates of duration and cost which can be expressed as percentiles.