

In 1948 architectural and engineering investigations found that the White House was unsafe for the President and his family. The scope of the project included the complete removal of the interior, except for the third floor, excavation of a new basement and construction of new foundations, replacing interior walls, refurbishment and replacement windows, and installation of new heating, ventilation, air conditioning, plumbing, electrical, and communications systems. Total budgeted cost was $5.4 million.
Actual construction work started on December 13, 1949. The original schedule called for the work to be completed by late 1951. However, the President was only able to return to the White House on March 27, 1952. Cost escalated due to a several factors including labor shortages and inflation. Cost overruns amounted to $321,000, but Congress agreed to fund only $261,000 of this, so the total cost of the project was $5.7 million. In addition, they also constructed a secret bomb shelter at a cost of $881,000, but that was funded separately.
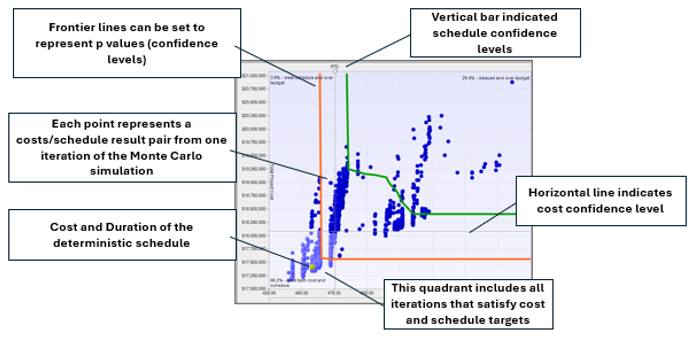
Joint Cost and Schedule Confidence Level chart
So, the project took approximately 12% longer and cost 6% more than originally planned. President Truman publicly expressed praise for the work, but the night of his return to the White House he wrote in his private diary: “With all the trouble and worry it is worth it – but not 5 1/2 million dollars! If I could have had been in charge of the construction, it would have been done for half the money and in half the time!”
We want to ensure projects will be both on budget and on time. This is what President Truman was thinking about. But due to risks and uncertainties, this can be difficult to achieve, as was the case with the White House renovation. For example, if we try to reduce costs by hiring the lowest bidders, we may end up with less experienced contractors who take longer to complete the work. Or vice versa, when we try to complete projects faster, we hire more people, and it costs more.
So, we need to estimate what is the chance that both cost and schedule will end up at a certain confidence level. To do this, we perform joint cost and schedule confidence level (JCL) analysis. NASA defines JCL analysis as “a process that combines a project’s cost, schedule, and risk into a complete picture”. If cost, schedule, or both are above a defined confidence level, it will require management to make some decisions regarding risk mitigation measures and/or changing the project scope.
JCL analysis is one of results of integrated cost and schedule Monte Carlo project risk analysis. During each iteration of a Monte Carlo simulation, the project cost, duration, and finish times are calculated. This information can be shown on a Joint Confidence chart.
Each point of the chart shows cost and finish time or duration of project for each iteration. This chart makes it possible to visualize the chance that both cost and schedule objectives will be met. The crosshair can be moved to a date and cost to obtain their joint confidence.