In many cases, project schedulers use “work” as input and output parameters. In this case, work is defined as a specific unit of time that a resource works on a task multiplied by the resource allocation ( the percentage of time that resources will be assigned to a particular task.) Depending upon the task type settings, work can be utilized to calculate the duration of the task or visa versa. As a result you may define uncertainties in duration and show the results as statistical distributions of both duration and work. Alternatively, you may define uncertainties in work or units. It is possible to define a distribution for both work and material resources assigned to the task. In addition, it is possible to define a statistical distribution for resource allocation units. For example, a resource could be allocated a particular task with a distribution of 30%-70%. However, distribution for units can become very complex and hard to maintain because resource allocations to different tasks should be correlated with each other.
Risk events can also have work or unit related impact type. Here are the examples of risk impact types:
- Fixed or relative work increase
- Fixed or relative resource allocation unit increase
- Cancel work of particular resource for particular task
- Reallocate resource to different task
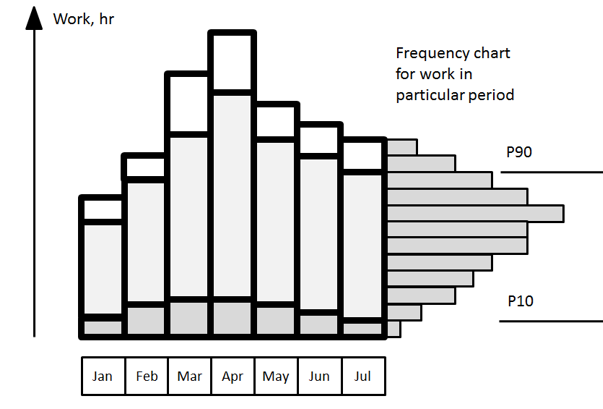
Resource peak units, allocation, work, or percent allocation for specific resource can be shown on the chart. These charts can show the results of your risk analysis. Each bar of the chart can show low (for example, P10), base, and high estimates of work or units. Essentially each bar has a statistical distribution behind this. This statistical distribution does not need to be explicitly shown, but some software will allow you to click on the bar and view the distribution. It is also possible to set the chart to show for low, base, and high estimates of work or units separately.