


Let’s assume task your project has two risks assigned to different tasks:
- Critical component failure
- Results of test are negative
Each risk may affect project differently. It can affect project duration, cost, quality, safety, security, technology, public relations, etc. These are the different risk categories. Impact of the risks on different categories can be different:
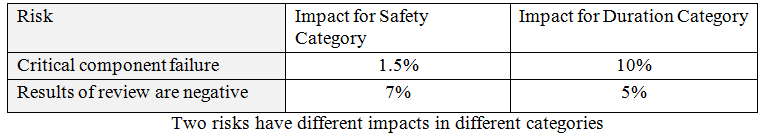
Let’s assume that probability of both risks is the same. If we compare risks only within a specific category, it would be very easy prioritize them. For the safety category, the most important risk would be “Critical component failure”. For the duration category, the most important risk would be “Results of review are negative”. It will just take longer to fight the scary guy than avoid the snake. The issue is what is the most important risk if we take all risk category impacts into consideration? Here is how we can solve this problem.
Each category has a priority. These priorities are used to adjust risk scores. Let assume that we have 5 categories. Theoretically we can just assign priority values to each category:
- Duration and Scope – 20%
- Safety – 40%
- Cost – 20%
- Legal – 10%
- Quality – 10%
It could be quite accurate if we have two or three categories, but if we have more categories we can do more precise calculation. We can ask people, how much more critical to your project or organization is Safety compared to Duration. We might say Safety is 3 times more important. We would then enter this number into the cell of Table 3.4 associated with Duration and Scope and Safety categories. The corresponding cell associated with both categories we have number equal to 1/3. We can repeat this process of all pairs of categories. In case of 5 categories it will result in 10 pairs of values. These numbers will be used to calculate priority for each category. This process is called pair-wise comparison. Why is it better than just entering priority as a single value? The reason is it is much easier to elicit relative importance of one category compared to another one. In other words, people will provide much more accurate values if they are asked to compare one category vs another rather than if they are asked just to provide a priority for each category. A similar process was proposed by Thomas L. Saaty in the 1970s for decision making. It is called analytic hierarchy process (AHP) (Saaty and Peniwati 2008).
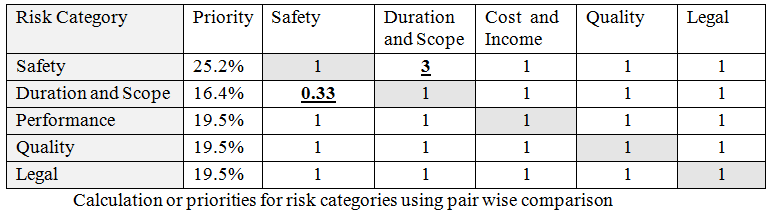
Here is how actual priorities are calculated:
- For each column we calculate sum of all value. For example, for first column it will be 4.33.
- Values in each column will be normalized or divided by the sum of this column. For example first value in column “Duration and Scope” will be 1 / 4.33 = 0.23
- The sum of normalized values for each row are calculated.
Now when we have priorities we can use it to calculate impacts for both risks in Table 3.3. Impact of each risk for each category will be multiplied on priority of this category. For example, we have risk “Critical component failure”. This risk has two impacts:
- Impact on duration = 10%
- Impact on safety = 1.5%
Now we can multiply these numbers on priorities (16.4% and 25.2% consequently). The results will be:
- Impact on duration = 10% * 0.164 = 1.64%
- Impact on safety = 1.5% * 0.252 = 0.378%
Then we can repeat these calculations for the second risk. The final step is normalizing results if we want to resent it on 0 to 100% scale. However it is not critical if we just want to see what risk is the most important.
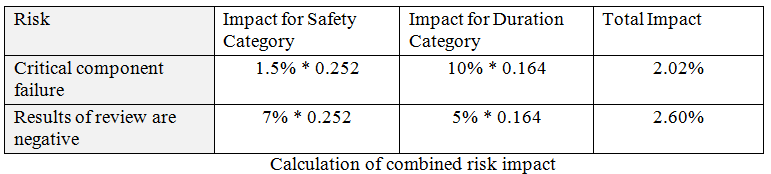
Based on our analysis, the most important risk for our example would be “Results of review are negative”.