

We are going to look briefly at a phenomena that can occur when using a risk matrix to prioritize your risks when performing quantitative risk analysis. There is an intrinsic limitation to risk matrixes that can occur that under certain conditions incorrectly prioritize risks. To illustrate, here is a Risk Matrix assessment for two risks.
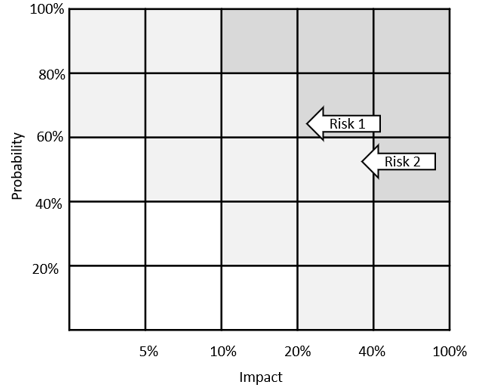
- Risk 1. Impact = 22%, Probability = 64%, Score = 14%
- Risk 2. Impact = 38%, Probability = 46%, Score = 17%
So, the risk score for Risk2 is greater than for Risk1. Nevertheless, Risk2 lands on the medium risk area of the risk matrix and Risk1 is on the critical area. The reason why we have this effect is because we are showing the risks on discrete cells rather than on continuous green-yellow-red (white-grey-dark grey) chart. In most cases, such as with qualitative analysis, this is acceptable, as impact and probabilities are not defined very precisely and is largely subjective assessment. However, with quantitative analysis, you get a more objective assessment of risk impacts that don’t aren’t as amenable to this type of analysis. For this reason, for quantitative risk analysis, we recommend prioritizing risks using the risk score as shown in the risk register. If you are really concerned about this effect, but are required to use a risk matrix, we recommend increasing number of cells in risk matrix or using a chart with incorporates gradients rather than cells.
To learn more about risk matrixes and their limitations please read:
Louis Anthony Cox Jr., 2009. Risk Analysis of Complex and Uncertain Systems. Springer