

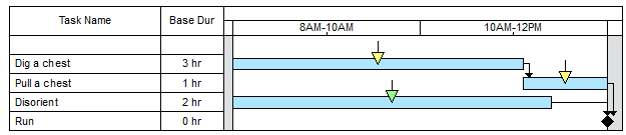
Event Chain Methodology deals with the analysis of a schedule with event chains. We can extend this process to use Monte Carlo simulations to prioritize events and event chains. Here is an example with a nod to our love of movies. Two pirates, Jonny Death and Orlando Plume found that a treasure chest was buried beneath the parking lot of the Miami Dolphin’s Stadium and planned to dig it out in the morning. However, Captain Barabusa, their archrival, has been keeping a close eye on the duo and suspects that they have discovered something of value. He intends to arrive at the parking lot at exactly the same time to steal whatever it is they are digging up. But our two clever pirates have a plan; while Jonny excavates the treasure chest, Orlando will attempt to fool Barabusa by telling him that Jonny has just been hired to repair the sewer and send Barabusa off in the wrong direction. As part of their plan, they created a project schedule:
The final question is how are Jonny and Orlando going to share the treasure? After some discussion, they decide that whoever assumes the most risk should receive the largest share of the treasure. They also agree that the most important risk is that which has the potential to cause the greatest delay in the project. They identified 3 risks.
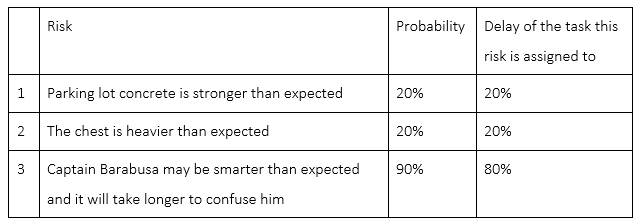
Based on this risk breakdown structure, Jonny will have to deal with the first two risks, while Orlando will deal with the last one. Orlando argues that he is assuming the most critical risk (90% chance that this risk will cause 80% delay) and that he deserves greater share of treasure. If we were performing qualitative analysis, where the risks are not assigned to the project schedule, he would be absolutely correct. However, if we use Monte Carlo simulations, the results can be decidedly different. Here is how the risk analysis works in this example. In each Monte Carlo simulation, changes in duration caused by particular risk are calculated. For example, in simulation 1 due to the risk “Parking lot concrete is stronger than expected” Task 1 experiences a delay of 0.6 hours. The table below shows an example of Monte Carlo results (in hours):
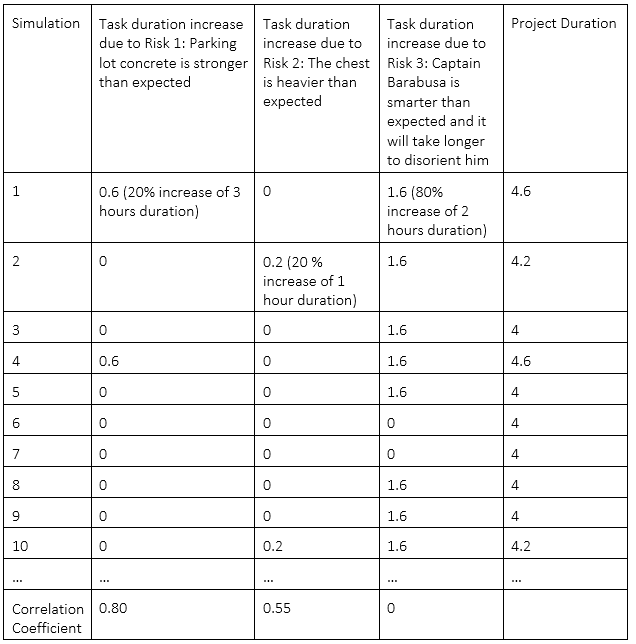
So, the correlation coefficient is calculated between increases in duration caused by specific risks (columns 1, 2, and 3) and project duration (column 4). Spearman Rank Order correlation coefficient between risk 3 and project duration equals zero. Why? Because the task “Disorient Barabusa” is not on the critical path. Even if the duration of the task increases by 1.6 hours (80%) due to the risk and reaches 3.6 hours, it will still be less than the duration of Jonny’s tasks: 3 hours +1 hours = 4 hours. It means that risk 3 does not affect project duration at all and the impact of this risk equals 0.
However, the correlation coefficient is not yet the “risk impact”. Here is the problem. Let us assume that our project has only one task “dig treasure” and one risk “Parking lot concrete is stronger than expected”. What would be the correlation coefficient between changes in duration caused by the risk and project duration? The answer is 100%. It indicates that each time the risk occurs the duration will increase. Now, what happens if this risk increases the duration by 90%, rather than 20%? The correlation coefficient will be the same. Spearman Rank Order correlation coefficient is the same when all values are multiplied by one number.
To avoid this problem the following calculation algorithm is used:
- Calculate correlation coefficient as a result of Monte Carlo simulation as described above.
- Calculate the project duration or cost with and without risks. Project duration with risk is the mean project duration. In our case project duration without risks and mean project duration as a result on Monte Carlo simulations (with risks) equals 4 hours.
- Calculate the impact coefficient = project duration with risk / (2 * project duration no risks). In our case impact coefficient equals 0.5.
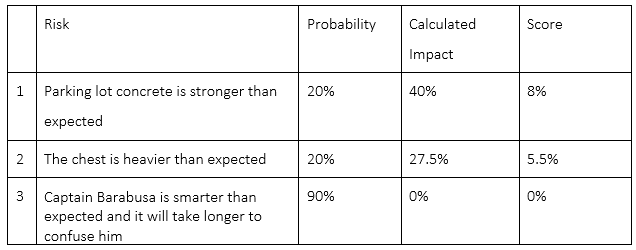
- Calculated risk impact equals correlation coefficient multiplied by impact coefficient. In our case impacts will be 40% = 0.8 * 0.5 * 100% and 27.5% = 0.55 * 0.5 * 100% for risks 1 and 2. Impact of risk 3 will be zero.
Project risk register with calculated risk impact and score is shown.
From this we can calculate that a risk that leads to a doubling of project duration or has an impact 100%. Why two times and not three or five? It is an arbitrary value: however; once we adopt this value and use it at an organizational level, it allows us to consistently compare the impact of risks across multiple projects. Finally, we calculate the risk scores as the risk probability multiplied by the risk impact and rank all risks based on these scores. So, in our example, Jonny should receive the greater share of the treasure because based on the project duration criteria our pirates choose, his risks have the most potential to increase the project duration.