

Project managers always want to know which task they should be most worried about, which tasks will could have the most impact on their project? The common method is to focus on those tasks on the critical path, however tasks that are not on the critical path may be impacted by risks and shift them in such a way that they impact project duration. Tasks, which have the most potential to affect the project parameters such as duration or cost, are called crucial tasks. This term is used to distinguish it from critical tasks, which are on the critical path of the project schedule.
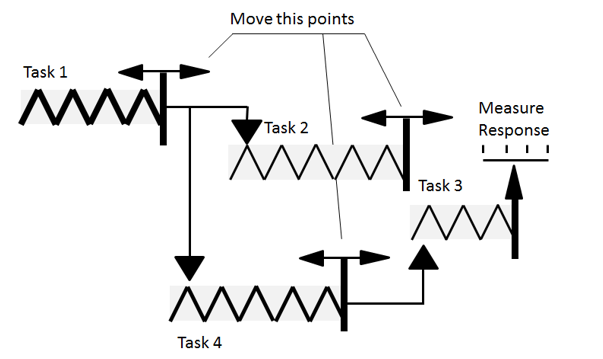
We can identify crucial tasks using sensitivity analysis. In general, sensitivity analysis determines how uncertainties in the output of a mathematical model are impacted by different inputs. In our case, sensitivity analysis determines how uncertainties in project duration, cost and other parameters are affected by uncertainties in task parameters. Let’s assume that each task is a spring and each spring has different stiffness. Tasks with less stiffness will have more uncertainty, that is they will expand or contract more if impacted by other tasks. We are trying to push or pull on each spring to measure the response on the last task. We can see an example of this below. Tasks that have the most effect on the movement of the system of springs (the schedule), are the most crucial tasks. Any risks that are assigned to these tasks need to be given high priority to understand how they can be managed.
We can identify crucial tasks by calculating the correlation between project parameters and task parameters. This is done using correlation coefficients, such as the Spearman correlation coefficient. Spearman is a nonparametric measure of the statistical dependence between two variables. When you perform Monte Carlo simulations, you will get a set of results for duration, cost, and other parameters for each task as well as for the project.
Let’s assume that you want to calculate the correlation coefficient for task duration and project duration. The Spearman formula compares the result for each task and the project on each iteration of Monte Carlo simulation. If longer task duration always (100%) corresponds with longer project duration and shorter task duration always corresponds with shorter project duration, correlation coefficient will be 1. If there is no relationship between two variables, the correlation coefficient will be zero. Please note that correlation coefficient does not depend on the nature or units of a variable, so you can calculate correlation coefficient between virtually anything, for example, the lag between tasks and project cost. These are the most common types of sensitivity analysis of a project:
- Project duration vs. task duration
- Project finish time vs. task finish time
- Project cost vs. task cost
- Project success rate vs. task success rate
- Project cost vs. task duration (in case if variable cost associated with resources)
Results of sensitivity analysis can be presented as Tornado Chart/ It is called a Tornado chart due to the characteristic shape the bars form that resemble the cone of a tornado.
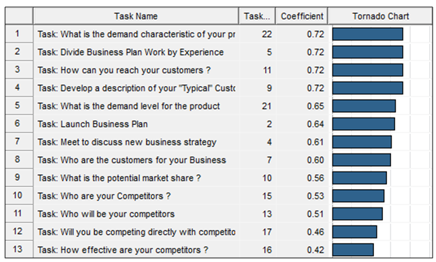
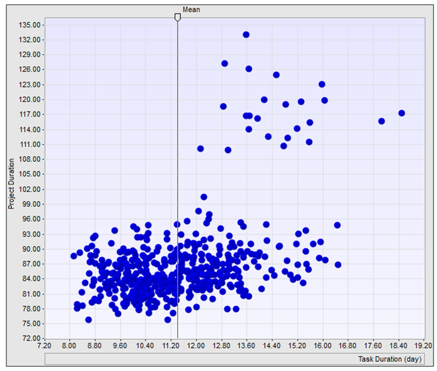
All tasks are sorted based on the correlation coefficient. Tasks with higher correlation between their duration and project duration are crucial and listed at the top. Scatter plots can be also a valuable tool for sensitivity analysis/ Each point on this chart represents the result of one iteration of the Monte Carlo simulation. If points are widely dispersed, it indicates that project duration is not strongly correlated with task duration. If points appear to be aligned in one direction, it indicates that project and task duration are strongly correlated.
Be aware, as with any analysis, sometimes different parameters may have “spurious” correlations. A popular example of this is how some people used to think that the stock market was correlated with the length of skirts. As skirts went up, so did stock markets according to this theory. In retrospect, this seems ridiculous, but it serves the purpose that if there is a strong correlation that appears unusual, you should investigate further.