

RiskyProject Risk Register is an optional value priced component for use with RiskyProject Enterprise. The Risk Register module is suitable for:
- Users who need access to the Risk Register for editing and reporting, but are not responsible for quantitative risk analysis.
- Projects that do not require quantitative project risk analysis on cost and schedule that includes Monte Carlo simulation.
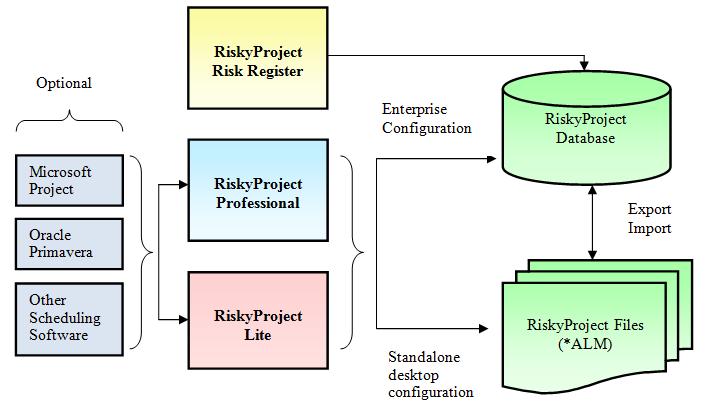
RiskyProject Risk Register allows to access the same RiskyProject Enterprise database as RiskyProject Professional or RiskyProject Lite, but has limited functionalities compared to RiskyProject Professional or RiskyProject Lite and much easier to use.
The Risk Register module includes all of risk management features found in the Professional version:
- Risk Assessment
- Risk Matrix
- Risk Dashboard
- Risk Mitigation and Response Plans
- Risk Reviews
- Risk History
- Risk Documents
- Complete set of Risk Reports
RiskyProject Risk Register allows you to manage access project portfolio without ability to access project schedules. It includes two view:
- Project Portfolio
- Risked Project
RiskyProject Risk Register also include ability to define and format risk matrix, define risk categories, risk properties, manage users, and receive notification messages about any changes to the risk.
The RiskyProject Risk Register allows you to identify, assess, manage and control your risks. It includes complete set of customizable properties, cost of risk calculation, risk lifecycle, threats and opportunities, risk mitigation waterfall chart, risk reviews, history, and documents.

The Risk Register includes the Project Portfolio view, which allows you to organize your projects into portfolio hierarchy with programs and projects. This helps you to easily locate your projects risk registers. The Project Portfolio view provides a high level report of your current portfolio’s schedules with risks and uncertainties.
The Risked Projects view displays the relative risk that your projects have as a bubble chart. Risk can be viewed as either Cost or Schedule using various indicators including Project Value at Risk, Standard Deviation and others

Mitigation and Response view allows you to create and manage your risk responses in one place. Once you have created your plans, you assign to the project risks. One plan can be assigned one or more risks and a risk can have one or more plans. If you assign mitigation plants to the risk, they can be presented on risk mitigation (waterfall) chart. Each mitigation and response plan has a cost assigned to them.

The Risk Matrix is an important tool for assessing and managing your risks. The Risk Matrix is completely customizable and can be modified to meet any probability and impact matrix configurations. In addition the Risk Matrix includes several additional views including the Risk Monitor, Risk Trends, and Total Risks.

The Risk Trend is a bar chart that shows the changes to the number of risks per severity category over the past year (or defined periods).

The Risk Monitor view shows the current number of risks as the sit on the probability and impact risk matrix. The Total Risks report shows changes to the number of risks in each severity category over a defined number of periods.

Risk Dashboard presents hundreds of different key performance indicators (KPIs) and charts related to your risks with a fully customizable Risk Dashboard. Dashboards can present data in a variety of ways including charts – line, area, pie, scatter, bar (including frequency histogram), meters, and risk matrixes. You can place them in different areas on the dashboard, and adjust their size, colors, and other properties. Dashboards can be annotated using text, lines, and images. Dashboards can be printed or exported.

Incidents are events that can be recorded, viewed and reported in RiskyProject. In RiskyProject, incidents are managed similarly to risks. RiskyProject has an Incident Register. This register is similar to Risk Register. Each Incident has a list of customizable properties that are a different set than risk properties. Risks and incidents can be linked to each other: one risk may have different incidents, while one incident may have multiple risks. Incidents have customizable impact classifications such as Severe Impact, Moderate Impact, Low Impact. The Incidents feature is only available in RiskyProject Enterprise and requires connection to a database.
These views can be accessed using Incident tabs within the ribbon: Incidents in the Incident Register and Incident Statistics as a chart showing occurrence of incidents over time.
