Linear projects or location based projects are usually construction projects, such as pipelines, buildings, and roads. In addition to standard scheduling data (start/finish times, duration, resources, and costs) each activity has location data. For visualizing location based projects, a popular alternative to Gantt charts are time location charts.
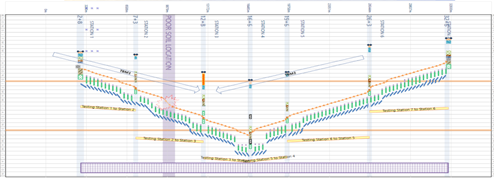
Time location or linear charts are a way of visualizing project schedules with linear locations on the horizontal axis, and dates on the vertical axis. Schedule activities are then plotted onto the chart according to the locations over which they occur and the start and finish data that the project schedule determines. This method is extremely effective in visualizing spatially how actual work will be performed and maximizes resource efficiency.
While, the appearance of time location charts is much different than the more common Gantt charts, they still include the requisite data (start time, finish time, duration, and task relationships) to allow for schedule risk analysis. When a schedule risk analysis has been performed, it is possible to generate a location based chart that compares the original vs a risk adjusted schedule. If you are familiar with RiskyProject, this type of view would be the equivalent of the Results Gantt, which shows the results of the simulation compared to the original schedule.
Creating a risk adjusted location based schedule is quite simple. First, depending upon the software you are using to generate the location based chart, set up the Simulation Results view which the specified columns and order of columns. Second, run a simulation. Third, export the results to Excel. At this point you may have to add the location based data for each activity. Finally, import the Excel data into the software that you are using to visualize the location based schedule.