


What is Project Control
Project controls is a process of gathering and analyzing current project performance to forecast and manage potential project cost and schedule outcomes. This analysis process commonly includes both Earned Value (EV) and quantitative risk analysis to produce forecasts. EV is a widely used methodology that uses past performance as the basis to produce deterministic project forecasts. The assumption is that past performance will predict the future. However, this is often not the case as different phases of a project may have different levels of risk and uncertainties.
Combining Risk Analysis and Project Performance Measurement
During project execution quantitative risk analysis also uses past performance, but it also takes into account future risks and uncertainties for cost and schedule to provide probabilistic forecasts that provide levels of confidence in meeting budget and schedule objectives.
For example in large software projects, system integration activities are particularly risky in that they have high levels of uncertainty and unique risks that could occur as opposed to the previous work developing software components. In this case, previous project performance, will most likely not be a good indicator of future performance and running quantitative risk analysis on a regular basis will provide project managers the additional information to improve their decision making.
Remaining Project Duration and Forecast Finish Time
When we perform project risk analysis, we calculate the project statistical distributions of project duration, finish time, and cost. But let us assume that a project is 60% completed. What would be the statistical distributions for remaining duration and cost of the project? By answering this question, we would be able to forecast project duration and cost at any moment during project execution.
The first step in this process requires us to calculate the remaining duration and cost for individual tasks. Once we have this data, we can then perform Monte Carlo simulations of the complete schedule with the one condition, the simulation starts where the actuals end. There are two ways how the analysis can be calculated. Here is an example, you have a task that was originally scheduled to be completed in 10 days, when we receive the actuals, we find that after 5 days it is 40% complete.
- If we know remaining duration. Based on our expert experience or historical data, we conclude that the task can be completed in 7-8 days. We define statistical distribution for remaining duration. The task duration on each iteration of Monte Carlo simulation will be actual duration (5 days) plus duration obtained from statistical distribution, for example, 7.6 days.
- We do not have good estimates for the remaining duration and want to calculate it automatically. In this case, we need to calculate projected duration of the task. In our example, it will be 5 days * 100% / 40% = 12.5 days. For the Monte Carlo simulation, we use the original statistical distribution of the task duration to generate samples e.g 10.6 days. The base duration will be 10 days. So the task duration on each iteration for Monte Carlo simulation while taking into account that our task is 40% completed is calculated using this formula:
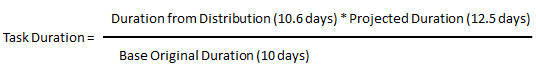 We can calculate task and project costs using the same process using % complete and actual costs.
Here is how a forecast of project or task duration can be presented graphically:
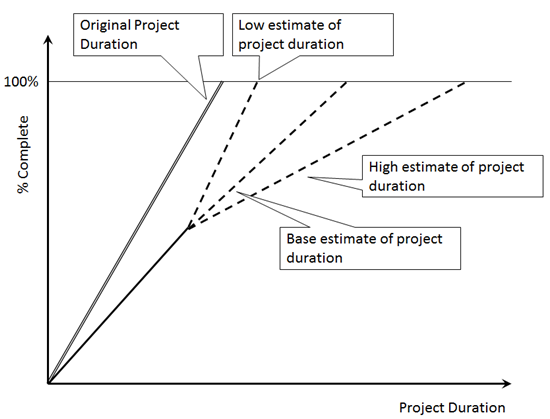 Low and high estimates of duration can be calculated either by defining remaining duration or by automatically extrapolating original duration.
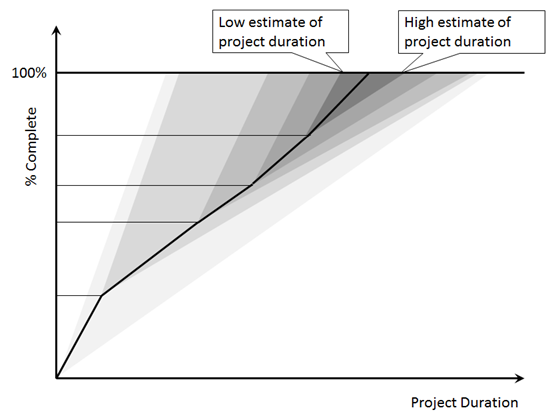
A probabilistic forecast for duration can be calculated at each phase of the project. In reality, the “fork”, or the range for statistical distributions of project duration should shrink over time as there will be less risk and uncertainty as the project progresses until the point where the project is finished and there are no more uncertainties. If the “fork” becomes wider close to the end of project, it is an ominous signal that a significant risk has been discovered and does not bode well for your project.
Tracking Gantt and Tracking Charts in RiskyProject
RiskyProject includes project performance monitoring views that allows project controllers and managers to enter actual performance (project status date and % complete) and then add estimated low and high remaining durations to activities as well as future risk events which have a probability and impact. If you are using a 3rd party scheduling software such as Microsoft Project, RiskyProject will read the project actuals and remaining durations. The results of the Monte Carlo simulation can be viewed as either a Tracking Gantt or Tracking Chart views.
![]()
In conclusion, you can improve your project controls process by including quantitative risk analysis to your forecasts by accounting for future uncertainties and risks.